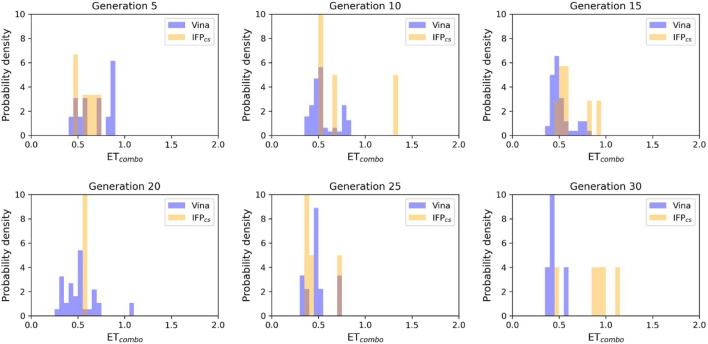
FIGURE 5.
The ability of the two Autogrow protocols in the benchmark de novo run to produce compounds that have a high degree of similarity concerning shape and electrostatic properties to the crystallographic ligands, chosen as reference. The probability distribution of the ET combo score for compounds populating each generation is reported as a histogram, where the vertical axis reports the probability density while the horizontal axis reports the ET combo value. Two distributions are reported within each plot: the blue bars refer to compounds generated with the VINA protocol, while the orange bars refer to compounds generated with the IFPCS one.

