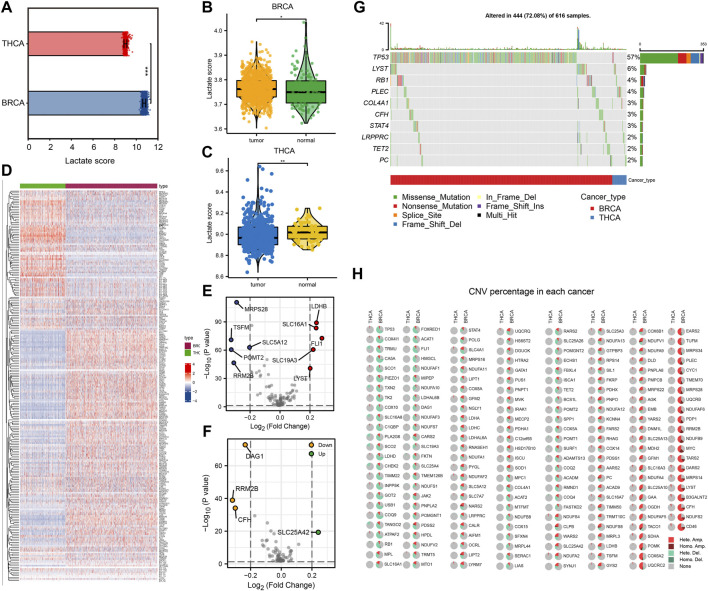
FIGURE 1.
Comparison of lactate metabolism score and expression of lactate metabolism-related genes in breast cancer (BC) and thyroid cancer (TC). (A) Comparison of lactate metabolism scores in BC and TC. (B) Comparison of lactate metabolism scores between normal and neoplastic tissues in BC. (C) Comparison of lactate metabolism scores between normal and neoplastic tissues in TC. (D) The expression of lactate metabolism-related genes in BC and TC. (E) Differentially expressed genes related to lactate metabolism in BC. (F) Differentially expressed genes related to lactate metabolism in TC. (G) Lactate metabolism-related genes with significant mutations in BC and TC. (H) Copy number variations in lactate metabolism-related genes in BC and TC.

