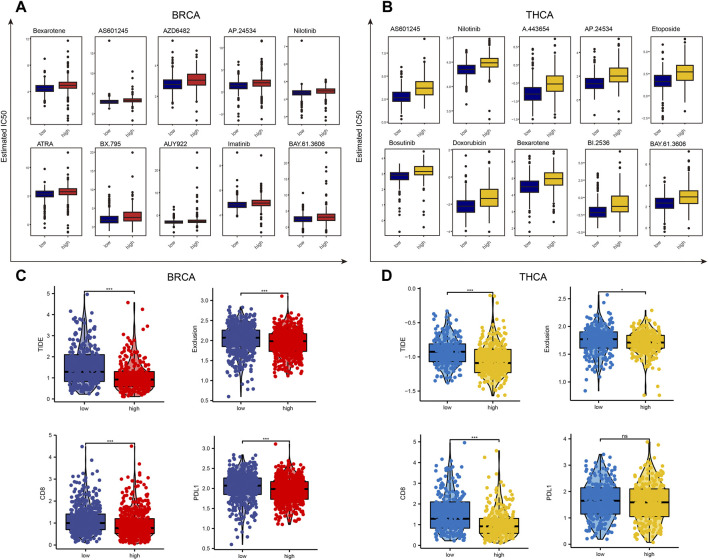
FIGURE 7.
Drug sensitivity analysis of patients with high and low lactate metabolism scores of breast cancer and thyroid cancer. (A,B) The GDSC database predicts the difference in sensitivity of patients with high and low lactate metabolism scores to different anticancer drugs, and 10 drugs with the most significant difference are ranked according to the p-values. (C,D) The difference in the susceptibility of patients with high and low lactate metabolism scores to immunotherapy and associated biomarkers as predicted by the TIDE algorithm.

