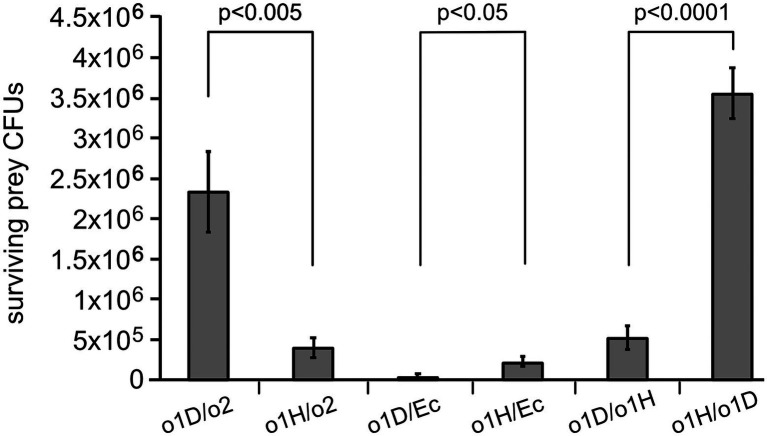
Figure 5.
Quantification of the killing of prey bacteria after pairwise competition. The graph represents the surviving CFU counts of prey bacteria after pairwise competition assays. Each pair is indicated as predator/prey for BFo1-D (o1D), BFo1-H (o1H), BFo2 (o2) and E. coli (Ec). The data are derived from three replicate experiments for each pair. The average CFUs recovered under non-challenged conditions for each strain were: BFo1-D 1.5 × 10⁷; BFo1-H 1.4 × 10⁷; BFo2 1.8 × 10⁷ and E. coli 1.9 × 10⁷.

