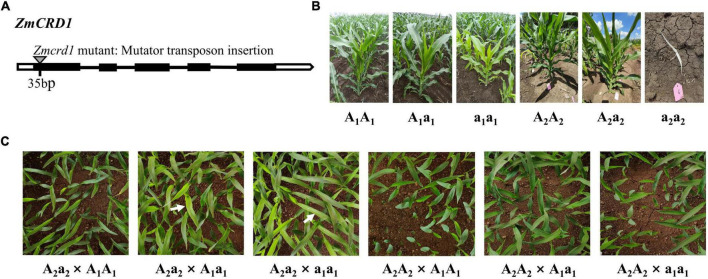
FIGURE 3.
The functional complementation assay between the pgl mutant and Zmcrd1 mutant. (A) The structure model of mutator insertion in the ZmCRD1 gene. (B) Phenotypic identification of mutational individuals of different genotypes used for the complementation allelic test. (C) Genetic analysis of pgl and Zmcrd1 associated F2 populations. Seedlings were grown to the third-leaf stage in greenhouse and then subjected to phenotyping. The white arrows point to the individuals with mutated phenotype.

