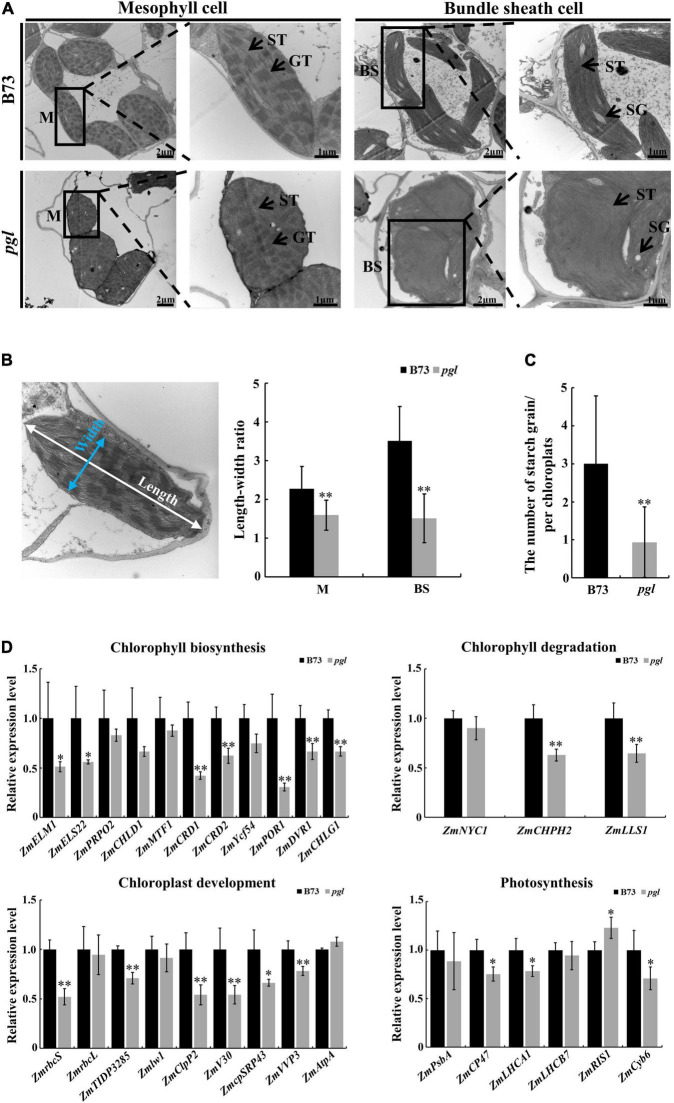
FIGURE 6.
Ultrastructure observation of chloroplasts and expression pattern analysis between B73 and pgl. (A) The ultrastructure of chloroplasts in mesophyll cells and bundle sheath cells between B73 and pgl. M, mesophyll cell; BS, bundle sheath; ST, stroma thylakoid; GT, grana thylakoid; SG, starch grain. Three biological replications were performed. (B) The length-width ratio of chloroplasts was compared in mesophyll cells and bundle sheath cells between B73 and pgl. Data are presented as the means ± SD (n = 15). (C) The number of starch grains was counted in chloroplasts of bundle sheath cells between B73 and pgl. Data are presented as the means ± SD (n = 16). (D) qRT-PCR analysis of genes associated with chlorophyll biosynthesis, chlorophyll degradation, chloroplast development and photosynthesis. Data are presented as the means ± SD (n = 4). Asterisks represent significant differences between B73 and pgl detected by independent sample T-test (*P < 0.05, **P < 0.01).

