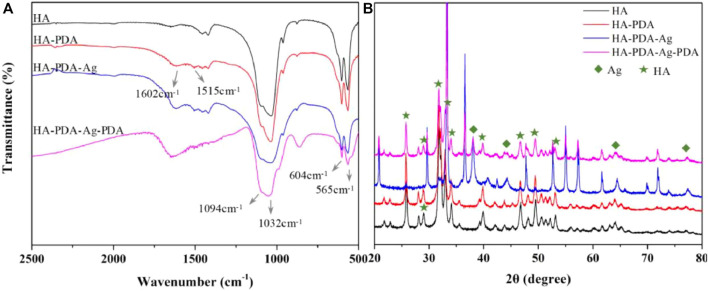
FIGURE 5.
After PDA modification and Ag decoration, changes of chemical components on HA substrates are detected by (A) FTIR, and the characteristic peaks are identified. The characteristic peaks of PDA (1602 cm-1 and 1515 cm-1) can be observed. Changes of crystalline structures are detected by (B) XRD analysis, and the crystalline structures stay unchanged after PDA modification, where the quadrangles represent peaks of Ag and the pentagrams represent peaks of HA. (Zhang et al., 2021). Copyright 2021, Elsevier.

