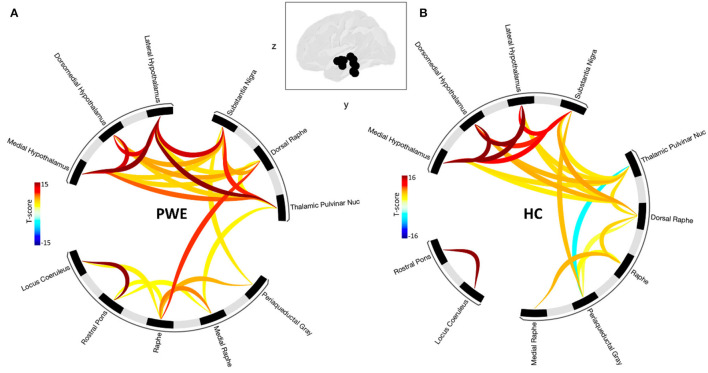
Figure 2.
Shows seed-seed functional network connectivity results as cluster-level interference ring. (A) The PWE group was characterized by a higher number of connections and higher mean connectivity strength compared to (B) healthy controls. Glass brain image represent seed regions used in the analysis. Dark to red connectivity lines signify stronger positive connectivity, lighter to blue connectivity lines denote decreased or negative connectivity. Functional network connectivity cluster threshold: p<0.05 cluster-level p-FDR-corrected (MVPA omnibus test); connection threshold.

