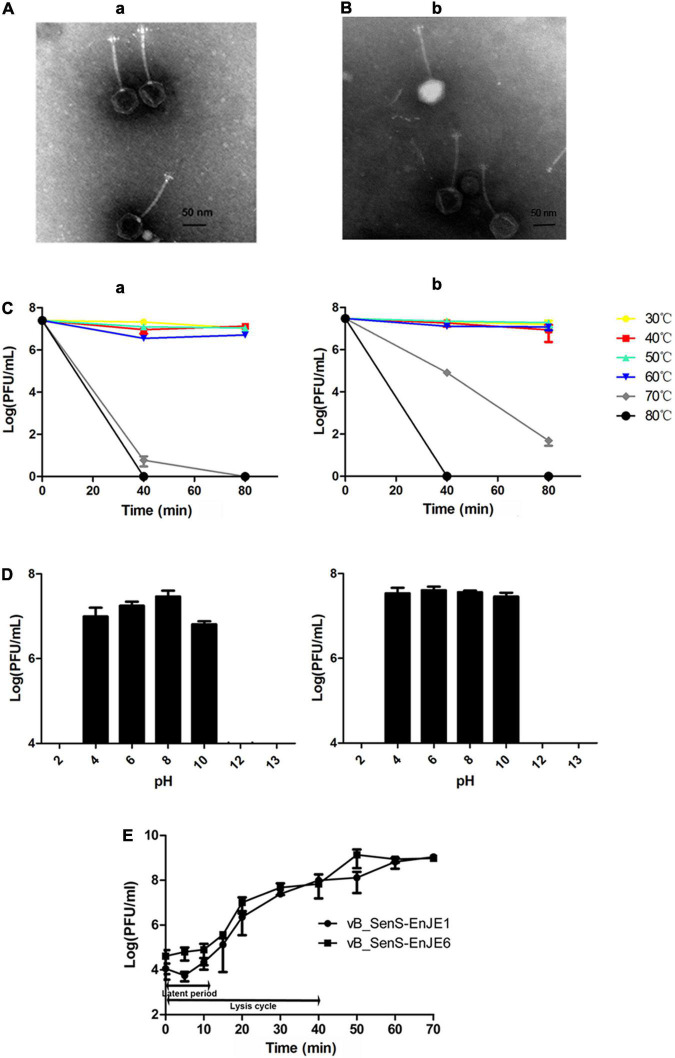
FIGURE 1.
Biological features of phages. Electron microscopy images of vB_SenS-EnJE1 (A) and vB_SenS-EnJE6 (B). The bar represents 50 nm. (C) Thermal stability of vB_SenS-EnJE1 (a) and vB_SenS-EnJE6 (b). Phage particles were incubated under different temperature conditions, and then, the samples were collected at 40 and 80 min after incubation. (D) pH stability of vB_SenS-EnJE1 (a) and vB_SenS-EnJE6 (b). Phage particles were collected after 1 h of incubation under different pH conditions. The titres of the phages at different pH values and thermal conditions were determined by the double layer agar method. (E) One-step curves of the two phages at MOI = 0.1. All experiments were repeated three times.

