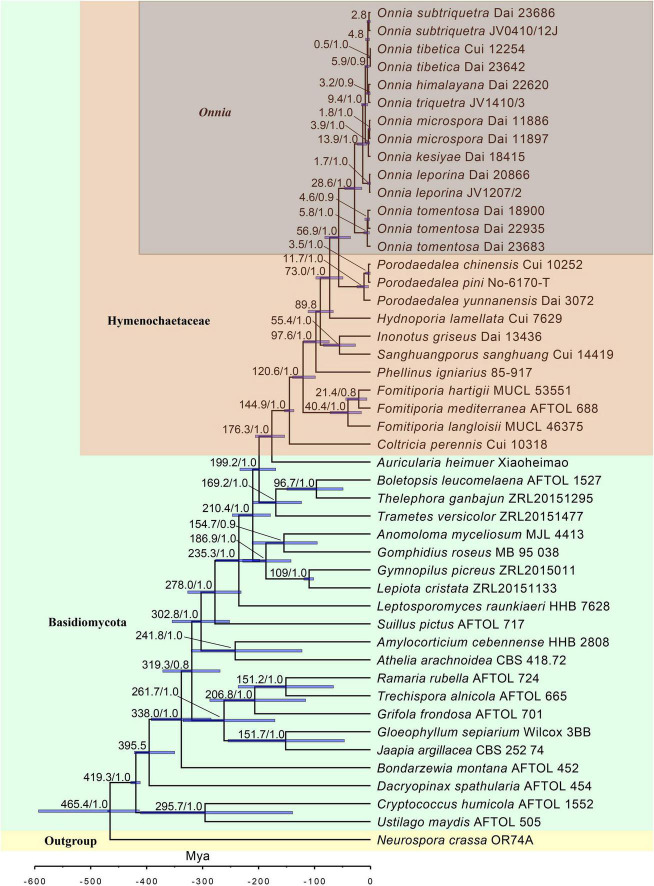
FIGURE 2.
Estimated divergence of Onnia generated from molecular clock analyses using a combined dataset of ITS, LSU rDNA, rpb1, rpb2, and tef1α sequences. Estimated mean divergence time (Mya) and posterior probabilities (PP) > 0.8 are annotated at the internodes. The 95% highest posterior density (HPD) interval of divergence time estimates is marked by horizontal blue bars.

