Figure 5.
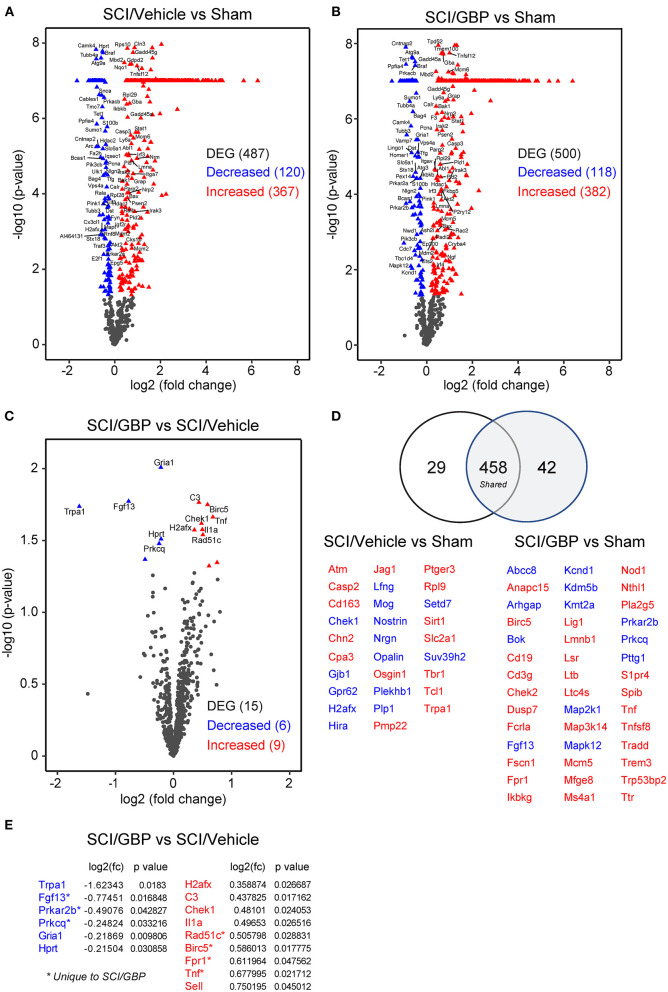
GBP administration does not attenuate neuroinflammatory gene expression. (A–C) Volcano plots of NanoString neuroinflammatory panel. The blue and red triangles represent differentially expressed genes (DEG). (D) The number of DEG in SCI mice administered vehicle and GBP are represented in the Venn diagram. In blue and red are the DEG associated to SCI/Vehicle and SCI/GBP groups. (E) DEG enriched in the SCI/GBP over the SCI/Vehicle group (p < 0.05).

