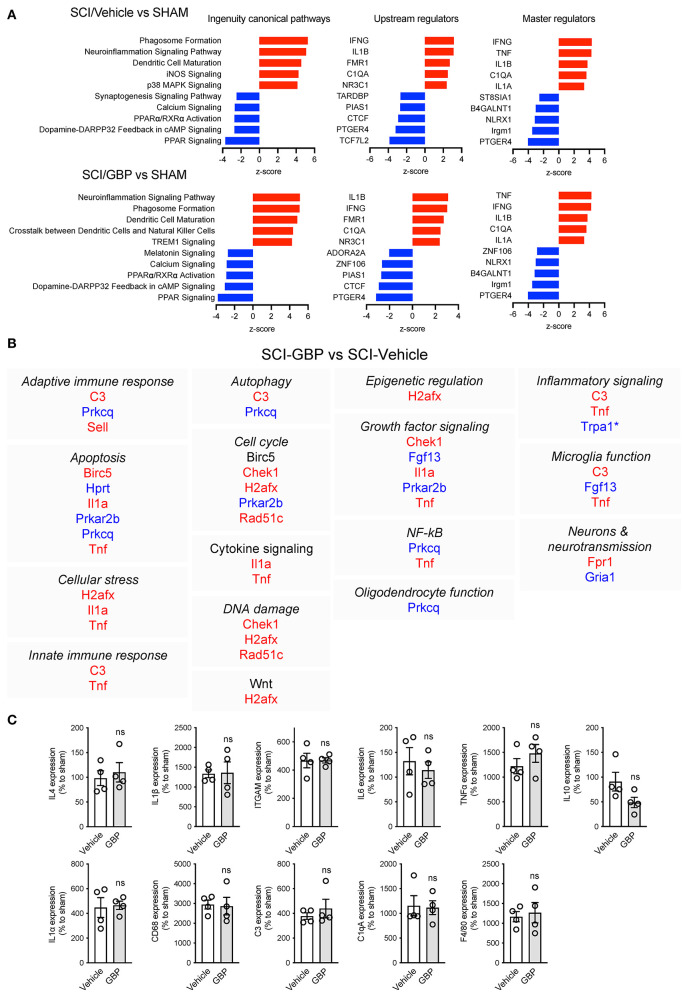
Figure 6.
(A) Ingenuity analysis of canonical pathways (z-score, p < 0.05), upstream (z-score, p < 0.05) and master regulators (z-score, p < 0.05) in SCI/Vehicle and SCI/GBP groups. (B) List of GBP-dependent changes in gene expression and associated cellular function. (C) Gene expression of inflammatory markers was analyzed by qRT-PCR. Mean and SEM (Wilcoxon rank sum test, ns: not significant; Sham n = 4, SCI/Vehicle n = 4, SCI/GBP n = 4).

