Figure 1.
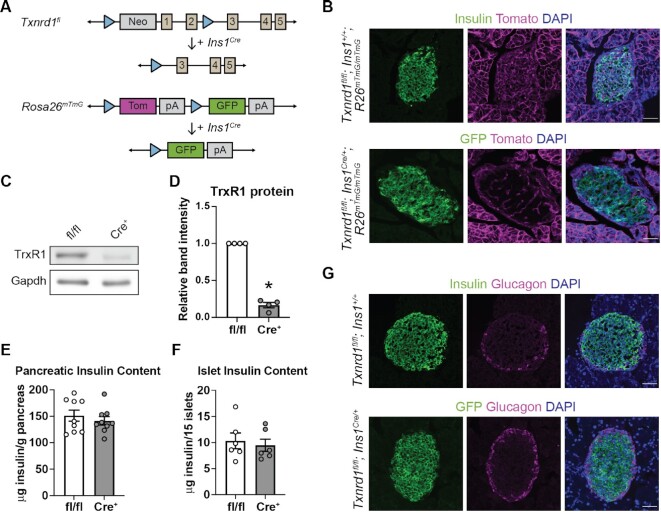
Generation of mice with a β-cell-specific Txnrd1 knockout. (A) Schematic of alleles used to generate β-cell-specific Txnrd1 knockout mice that also express a fluorescent Cre-reporter allele. (B) Representative images from pancreatic sections of Txnrd1fl/fl, Ins1+/+, R26mTmG/mTmG (control) or Txnrd1fl/fl, Ins1Cre/+, R26mTmG/mTmG (knockout) mice showing native fluorescence of GFP and Tomato and immunofluorescence of insulin. DAPI was used to mark nuclei. Scalebar = 50 μm. (C) TrxR1 protein levels as determined by western blot analysis using islets from Txnrd1fl/fl, Ins1+/+ (fl/fl) or Txnrd1fl/fl, Ins1Cre/+ (Cre+) mice. Gapdh levels were determined to assess protein loading. A representative blot is shown. (D) Quantification of bands shown in (C). (E–F) Pancreatic (E) or islet (F) insulin content in Txnrd1fl/fl, Ins1+/+ (fl/fl) or Txnrd1fl/fl, Ins1Cre/+ (Cre+) mice. (G) Representative images from pancreatic sections of Txnrd1fl/fl, Ins1+/+, R26mTmG/mTmG (control) or Txnrd1fl/fl, Ins1Cre/+, R26mTmG/mTmG (knockout) mice showing native fluorescence of GFP and immunofluorescence of insulin and glucagon. DAPI was used to mark nuclei. Scalebar = 50 μm. Error bars represent SEM. Results are the average of 3–9 independent experiments with statistical significance indicated. *P <0.05 (vs. fl/fl).

