Figure 2.
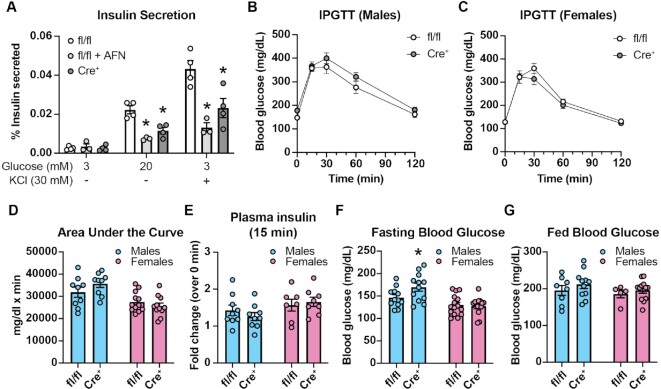
Glucose homeostasis in mice with a β-cell-specific Txnrd1 knockout. (A) Static insulin secretion following 90-min stimulation with 3 m m glucose, 20 m m glucose, or 30 m m KCl from Txnrd1fl/fl, Ins1+/+ (fl/fl) islets with or without 5 μm AFN and from Txnrd1fl/fl, Ins1Cre/+ (Cre+) islets. Secretion was normalized to total insulin and is shown as % insulin secreted. (B–C) Intraperitoneal glucose tolerance tests (IPGTT) in male (B) or female (C) Txnrd1fl/fl, Ins1+/+ (fl/fl) and Txnrd1fl/fl, Ins1Cre/+ (Cre+) mice. (D) Area under the curve measurements for data shown in (B) and (C). (E) Plasma insulin levels in male and female Txnrd1fl/fl, Ins1+/+ (fl/fl) and Txnrd1fl/fl, Ins1Cre/+ (Cre+) mice before and 15 min following intraperitoneal glucose injection. Results are expressed as fold change over the basal plasma insulin level. (F–G) Blood glucose concentrations following a 4-h fast (F) or following ad libitum feeding (G) in male and female Txnrd1fl/fl, Ins1+/+ (fl/fl) and Txnrd1fl/fl, Ins1Cre/+ (Cre+) mice. Error bars represent SEM. Results are the average of 3–4 independent experiments with statistical significance indicated. *P <0.05 (vs. fl/fl).

