Figure 5.
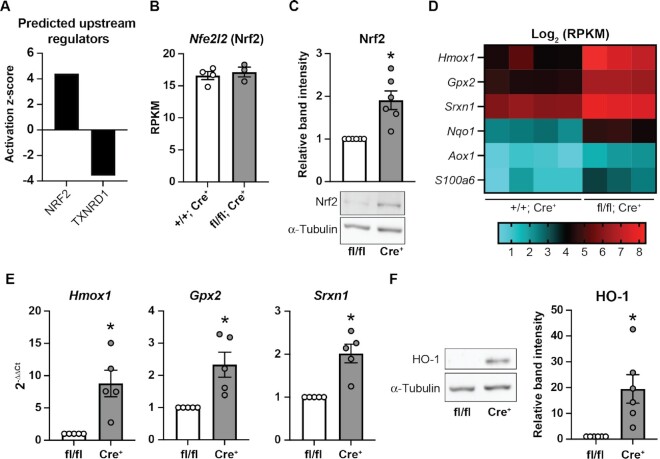
Nrf2 is stabilized in Txnrd1-deficient β-cells. (A) Predicted upstream regulators based on significantly changed genes in Txnrd1 knockout GFP+ cells compared to control GFP+ cells. Analysis was performed using IPA. (B) Expression of Nfe2l2 in Txnrd1+/+, Ins1Cre/+ (+/+; Cre+) or Txnrd1fl/fl, Ins1Cre/+ (fl/fl; Cre+) β-cells as determined by RNA-sequencing. (C) Nrf2 protein levels as assessed by western blot in Txnrd1fl/fl, Ins1+/+ (fl/fl) and Txnrd1fl/fl, Ins1Cre/+ (Cre+) islet lysates. α-Tubulin levels were determined to assess protein loading. Band quantification is shown above a representative blot. (D) Heat map showing Log2 (RPKM) of selected genes in four Txnrd1+/+, Ins1Cre/+ (+/+; Cre+) β-cell samples, and three Txnrd1fl/fl, Ins1Cre/+ (fl/fl; Cre+) β-cell samples as determined by RNA-sequencing. All genes shown are significantly different between the genotypes. (E) Expression of Hmox1, Gpx2, and Srxn1 in Txnrd1fl/fl, Ins1+/+ (fl/fl), and Txnrd1fl/fl, Ins1Cre/+ (Cre+) islets as determined by qPCR. (F) HO-1 protein levels as assessed by western blot in Txnrd1fl/fl, Ins1+/+ (fl/fl) and Txnrd1fl/fl, Ins1Cre/+ (Cre+) islet lysates. α-Tubulin levels were determined to assess protein loading. Band quantification is shown to the right of a representative blot. Results are the average of 3–6 independent experiments with statistical significance indicated. *P <0.05 (vs. fl/fl).

