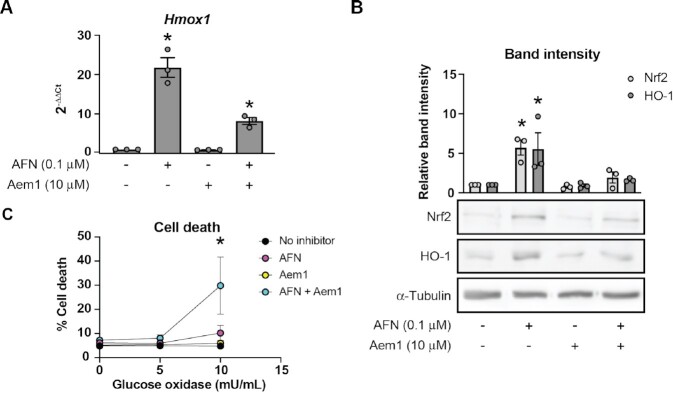
Figure 7.
Nrf2 stabilization protects β-cells from oxidants in the context of Txnrd1 disruption. (A and B) Hmox1 mRNA levels as assessed by qPCR (A), and Nrf2 and HO-1 protein levels as assessed by western blot (B) using lysates from INS 832/13 cells treated for 3 h with TrxR inhibitor AFN, with Nrf2 inhibitor Aem1, or the combination of the two at the indicated concentrations. α-Tubulin levels were determined to assess protein loading in (B). A representative blot is shown below quantification of bands. (C) Death, as determined by Sytox cell death assay, of INS 832/13 cells after 3 h pretreatment with AFN, Aem1, or both together and followed by 4 h treatment with glucose oxidase at the indicated concentrations. Error bars represent SEM. Results are the average of 3–4 independent experiments with statistical significance indicated. *P <0.05 (vs. No inhibitor).

