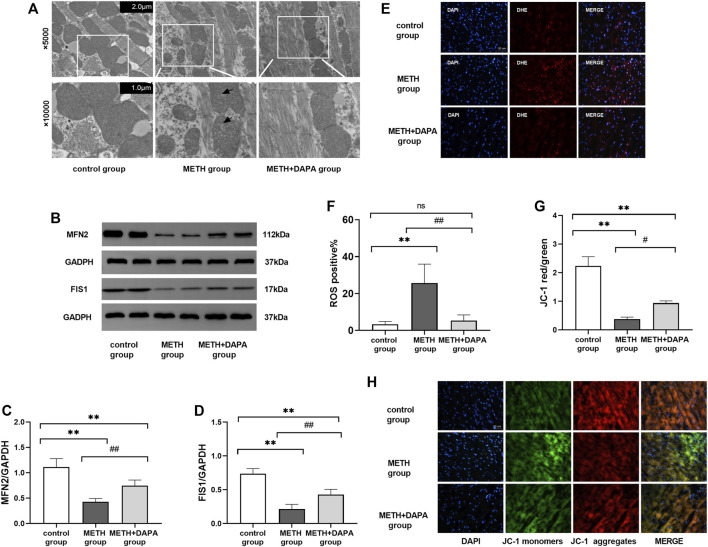
FIGURE 3.
Oxidative stress and mitochondrial damage. (A) Representative electron microscope photographs from the three groups. Mice in the METH group showed the rupture of mitochondrial cristae (white arrow) compared with the control group and METH + DAPA group. (B) Representative bands of the expression of the mitochondrial protein MFN2 and FIS1 in each group. (C) and (D) Quantitative analysis of the expression of the mitochondrial protein MFN2 and FIS1 in each group. (E) Representative ROS staining in each group. ROS was stained red by DHE. (F) Quantitative analysis of ROS staining. ROS staining was quantified in terms of DHE positive cells/total cells. (G) Representative figure of JC-1 staining. Red fluorescence intensity represents the number of aggregate mitochondria, while green fluorescence intensity represents the number of monomeric mitochondria. (H) Quantitative analysis of JC-1 staining according to the red optical density/green optical density. * p < 0.05 vs. the control group, ** p < 0.01 vs. the control group. *p < 0.05 vs. the METH group, ## p < 0.01 vs. the METH group. ROS, reactive oxygen species; METH, methamphetamine; DAPA, dapagliflozin; ROS, reactive oxygen species; DHE, Dihydroethidium; MFN2, mitochondrial fusion protein 2; FIS1, fission1.

