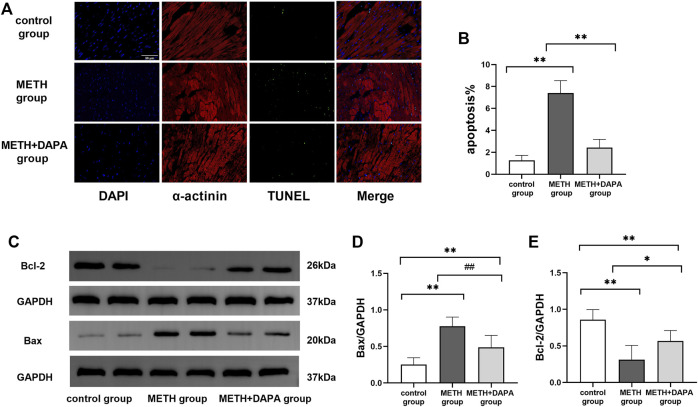
FIGURE 4.
Myocardial apoptosis. (A) Representative TUNEL-α-actinin immunofluorescence double staining in each group. The myocardial cells were labeled with α-actinin and stained red, while the apoptotic nuclei were stained green. (B) Quantitative analysis of TUNEL staining by FITC/DAPI in each group. (C) Representative bands of Bax and Bcl-2 in each group. (D) and (E) Quantitative analysis of Bax and Bcl-2 expression in each group. ** p < 0.01 vs. the control group. # p < 0.05 vs. the METH group, ## p < 0.01 vs. the METH group. METH, methamphetamine; DAPA, dapagliflozin; Bax, Bcl-Associated X; Bcl-2, B-cell lymphoma-2.

