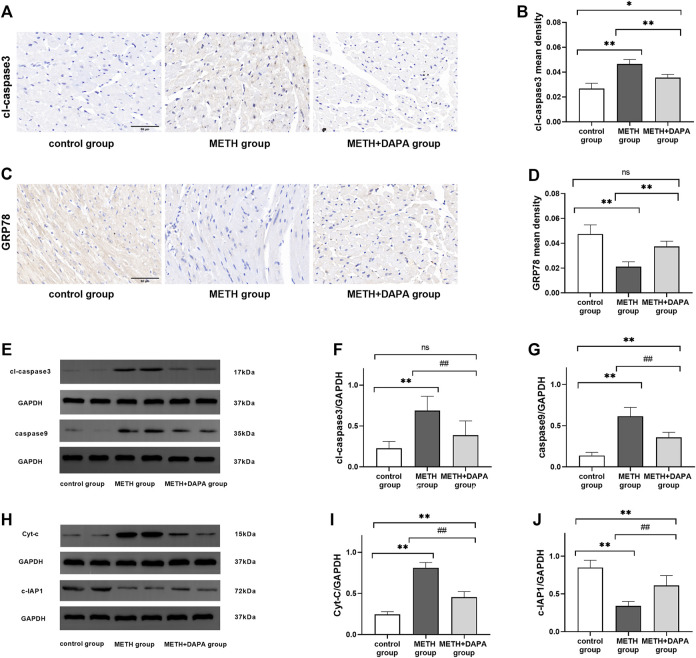
FIGURE 5.
Signaling pathway protein expression. (A) Representative image of cleaved caspase3 by immunohistochemistry in each group. (B) Quantitative analysis of cleaved caspase3 by immunohistochemistry in each group. (C) Representative image of GRP78 by immunohistochemistry in each group. (D) Quantitative analysis of GRP78 by immunohistochemistry in each group. (E) Representative bands of cleaved caspase3 and caspase9 in each group. (F) and (G) Quantitative analysis of the expression of cleaved caspase3 and caspase9 in each group. (H) Representative bands of Cyt-C, cIAP1 in each group. (I) and (J) Quantitative analysis of the expression of Cyt-C and cIAP1 in each group. * p < 0.05 vs. the control group, ** p < 0.01 vs. the control group.# p < 0.05 vs. the METH group, ## p < 0.01 vs. the METH group. METH, methamphetamine; DAPA, dapagliflozin; cl-caspase3, cleaved caspase3; GRP78, glucose regulated protein; Cyt-C, cytochrome C; cIAP1, inhibitor of apoptosis 1.

