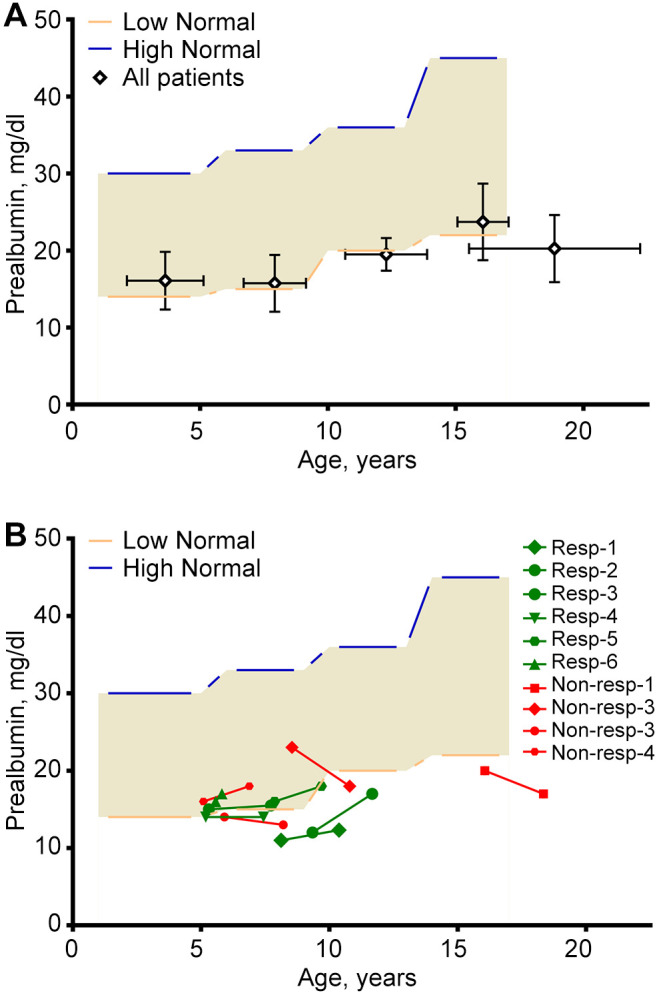
Figure 3. Prealbumin versus age. Light brown areas represent reference ranges for different age groups: 1-5, 6-9, 10-13, and 14-17 years. (A) Mean (±SD) values of prealbumin in corresponding age groups. Numbers of prealbumin samples in different age groups, from left to right: n=53, n=38, n=2, n=36, and n=28 (for >17 years). (B) Paired prealbumin levels (0-6 mo) before and (in average 23 months) after Gln in 10 patients. Up-sloping green lines represent patients with increased prealbumin and decreased APC values (i.e., L-glutamine responders). Red lines represent prealbumin levels for non-responding patients (i.e., their APCs did not decrease after Gln). APC: Annual pain crisis.

