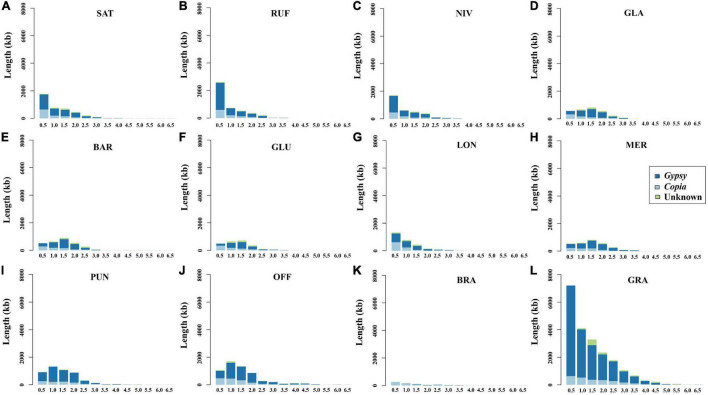
FIGURE 5.
Length of intact LTR-RTs inserted in the twelve examined Oryza genomes at different time periods. The values on the abscissa represent the insertion time span of the intact LTR-RTs, and the adjacent values take 0.5 as an interval value. For example, 1 represents the time period from 0.5 to 1 million years ago (MYA). (A–L) Represents O. sativa, O. nivara, O. rufipogon, O. barthii, O. glaberrima, O. glumaepatula, O. longistaminata, O. meridionalis, O. punctata, O. officinalis, O. brachyantha, and O. granulata, respectively.

