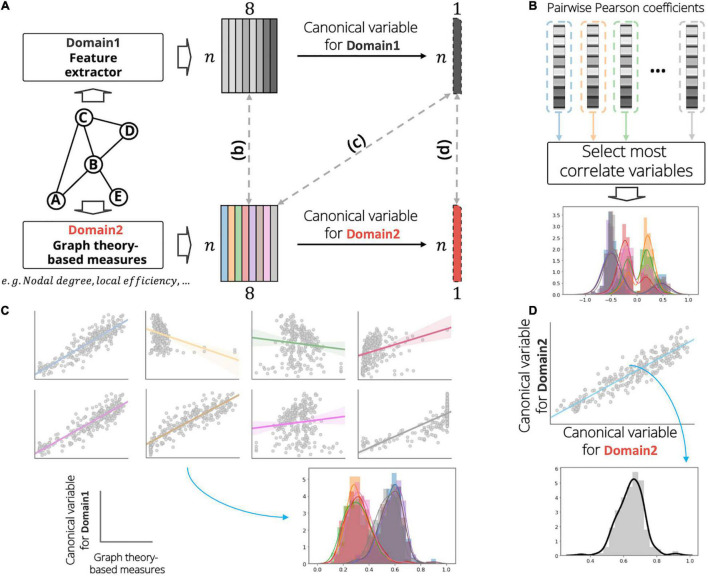
FIGURE 2.
Graphical illustration of analysis on investigating the relationship between the extracted features (domain 1) and graph theory-based nodal measurements (domain 2). (A) Example of the analysis for identifying association between a sample graph data (consisting of five nodes and five undirected-, and unweighted-edges). In this figure, the number of nodal measurements and the number of extracted features were set to eight. At each domain, we calculate a linear combination to obtain the canonical variables. (B) First, we calculate pairwise univariate Pearson correlation coefficients between domains and select a most correlation variable for each nodal measurement. (C) Second, we calculate the Pearson correlation coefficients between the canonical variable of domain 1 and the measurements of domain 2. (D) Last, we derive the Pearson correlation coefficient between the canonical variables among domains. In the distribution plot, x-axis and y-axis indicate the correlation value and corresponding density, respectively. In the scatter plot of panel (C), gray circles, solid lines, and shaded region demonstrate subject samples, linear regression line, and standard error for all samples, respectively.

