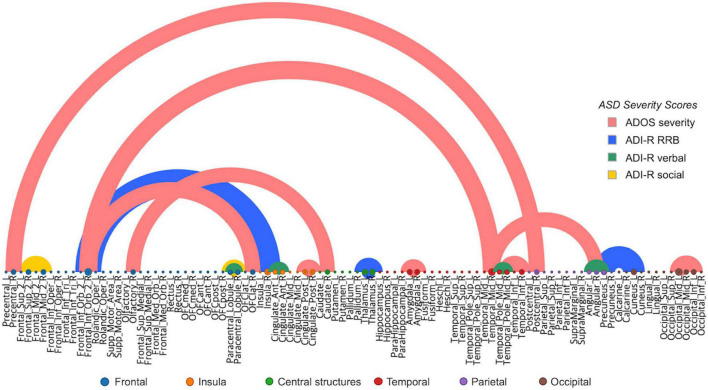
FIGURE 5.
Most predictive connections for ASD severity score (Red), ADI RRB (Blue), ADI verbal (Green), and ADI social (Yellow), learned by our proposed model. For each severity score, the connections that have the top 10% magnitude were shown for clarity. Thickness of the line represents the magnitude of partial derivative.

