FIGURE 1.
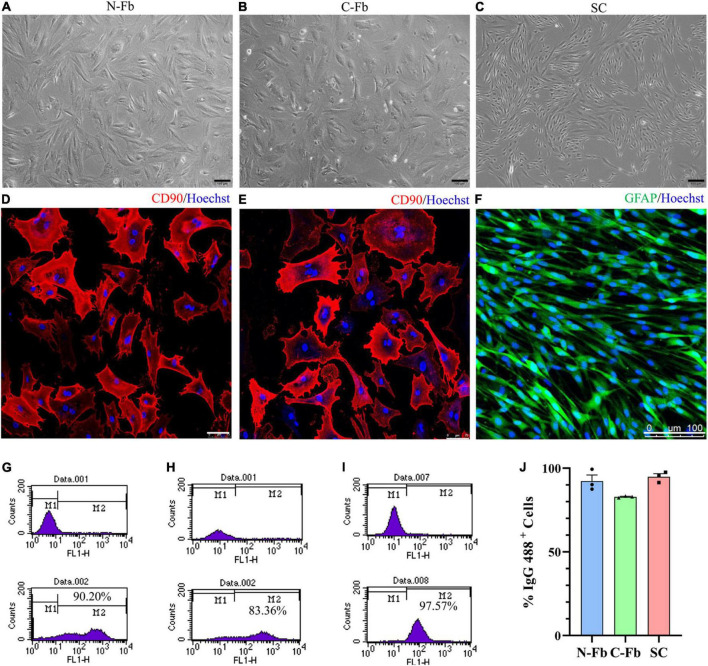
Cell characterization and purification. Phase-contrast micrographs of live primary cultured N-Fbs (A), cardiac fibroblasts (B), Schwann cells (C). Scale bar, 100 μm. Immunofluorescence for fibroblast marker CD90 in purified N-Fbs (D), C-Fbs (E), and SC marker GFAP in purified SCs (F). Scale bar: (D,E) 75 μm; (F) 100 μm. Representative figures of flow cytometry analysis of purified N-Fbs (G), C-Fbs (H), SCs (I). The upper graphics are control groups, and the lower graphics are experimental groups. M1/M2 stood for the area under the curve in upper/lower graphics; the percentage of M2 relative to M1 + M2 was the percentage of IgG 488-positive cells. (J) The purity of N-Fbs, C-Fbs, and SCs (three independent experiments).

