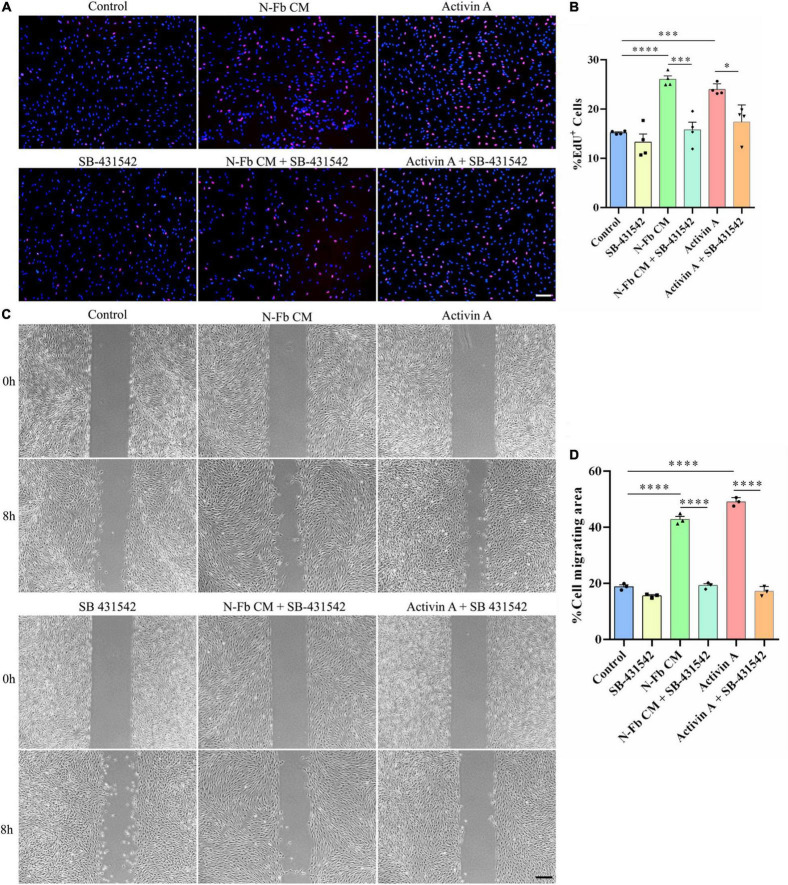
FIGURE 6.
SB-431542 inhibits the proliferation and migration promotion effects of N-Fb CM and activin A on Schwann cells in vitro. (A) EdU+ SCs (red) were labeled after 24-h culture. Scale bar, 100 μm. (B) Quantification of the proportion of EdU+ SCs. Statistical significance is indicated as *p < 0.05, ***p < 0.001, ****p < 0.0001 (four independent experiments, one-way analysis of variance followed by Tukey’s post hoc test). (C) Phase-contrast micrographs of SCs in the cell-free gap at 0 h and 8 h (after 12 h pretreatment). Scale bar, 200 μm. (D) Quantification of the SC migrating area percentage relative to the cell-free area at 0 h (three independent experiments). Statistical significance is indicated as ****p < 0.0001 (one-way analysis of variance followed by Tukey’s post hoc test).

