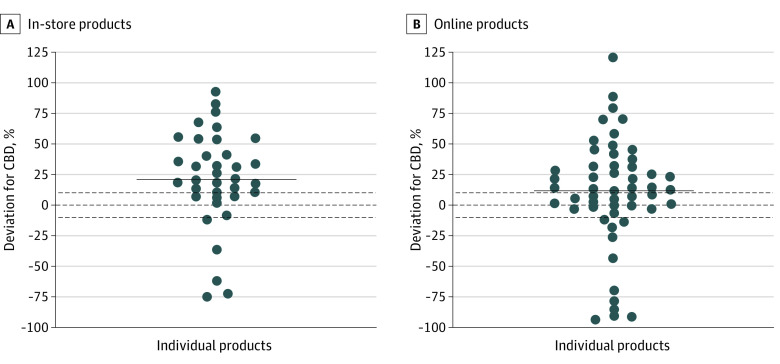
Figure. Percentage Deviation Between Actual and Labeled Amount of Cannabidiol (CBD) for Each Individual Product That Included an Amount of CBD (in Milligrams) on the Label, Stratified by Purchase Source.
Graphs show data for 89 products purchased in a store (A) and online (B). The solid lines depict the median percentage deviation. Zero (middle dashed line) indicates perfect agreement between actual and labeled CBD amounts, values greater than 10 (top dashed line) indicate the product contained more CBD than advertised (ie, underlabeled), and values less than −10 (bottom dashed line) indicate the product contained less CBD than advertised (ie, overlabeled). Each circle corresponds to an individual product.

