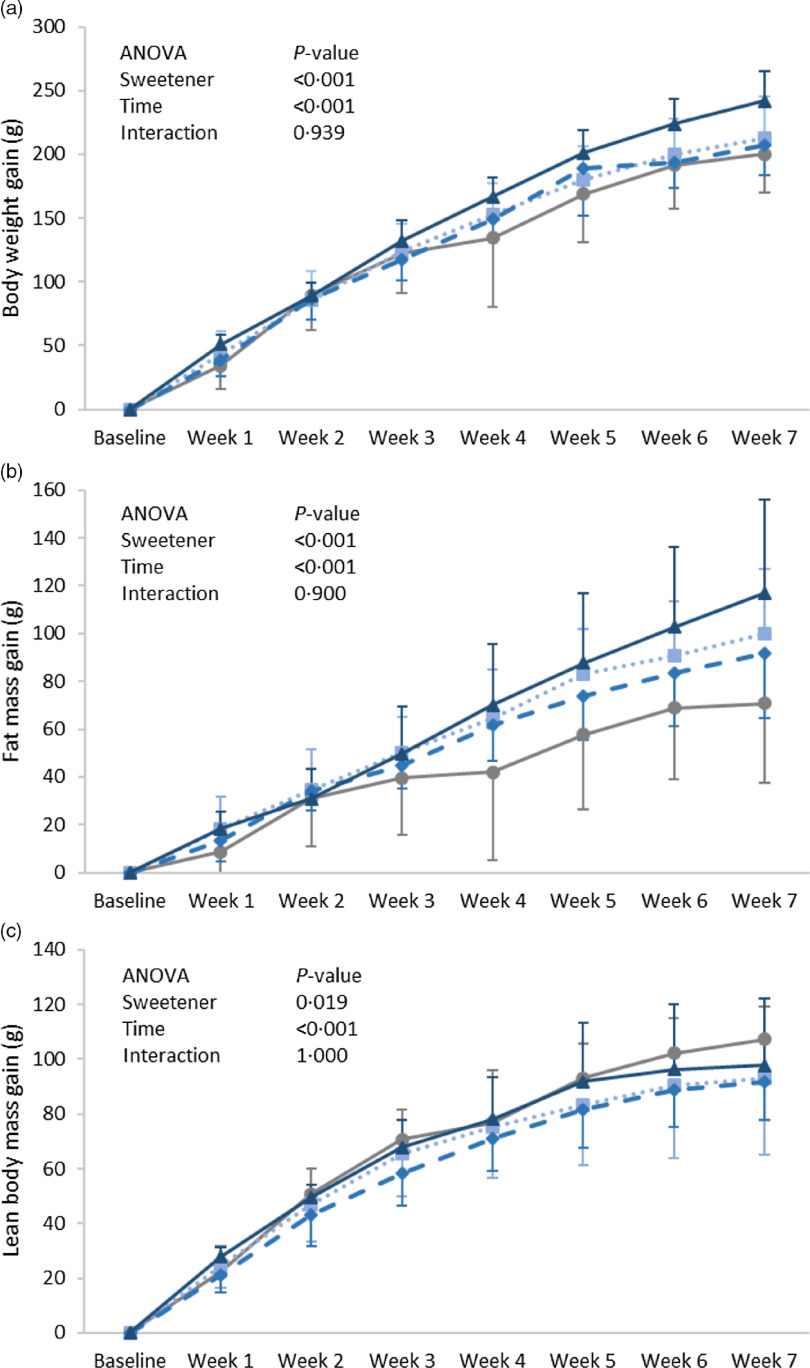
Fig. 1.
Expt 1 – weekly body weight (a), lean body mass (b) and body fat (c) of the four groups of rats in Expt 1 over the 8-week experimental period. Group C – control: starch-based diet and plain water; Group AD: aspartame-sweetened diet and plain water; Group AW: starch-based diet and aspartame-sweetened water; Group ADW: aspartame-sweetened diet and water. Data are expressed as the mean ± sd of all values. A two-way ANOVA was performed with time and group as factors. Significance was set at P-value < 0·05.  , C;
, C;  , AD;
, AD;  , AW;
, AW;  , ADW.

