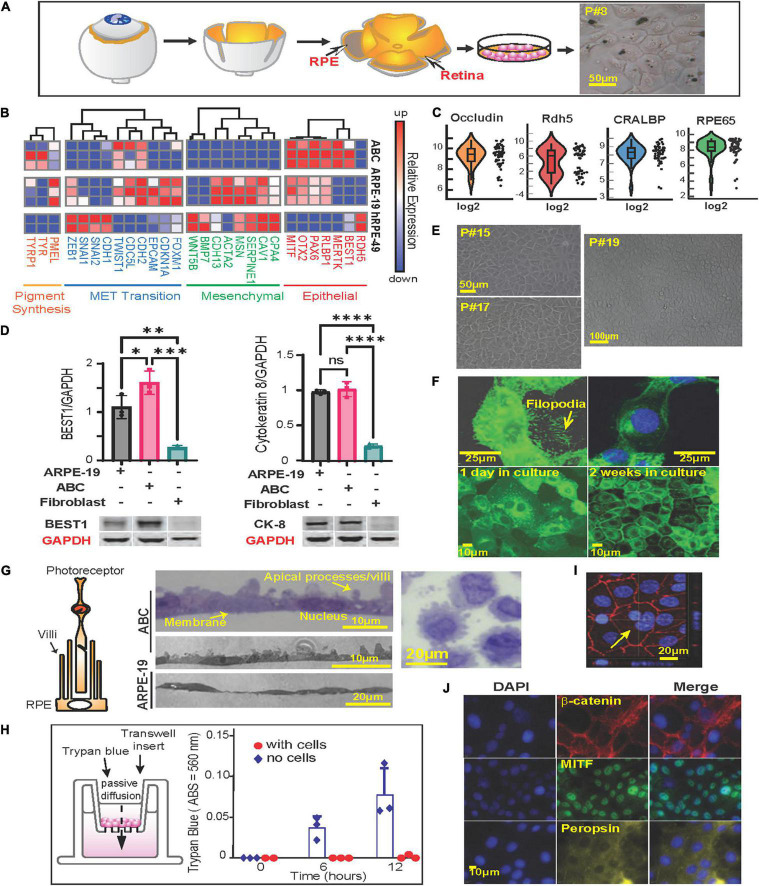
FIGURE 1.
Phenotypycal characteristics of primary human RPE (ABC cells). (A) RPE cells were isolated from human donor eyes and grown in tissue culture. Schematic representation of the protocol used for the isolation of RPE cells. Right panel shows light microscopy photograph of passage 8 (P#8) ABC cells with melanosomes. (B) Heatmap showing RNA sequencing results comparing ABC, ARPE-19 and human primary RPE cells from a 49-year-old donor (hRPE49) mRNA expression levels for Pigment synthesis, MET Transition signaling, Mesenchymal and Epithelial markers. (C) Violin plots of single-cell RT-PCR for ABC cells showing distribution of RPE-specific markers whitin the population. (D) Western blot comparison of the levels of Cytokeratin-8, and Bestrophin-1 (BEST1). The bars represent the mean and SEM of 3 independent measurements. GAPDH was used for standardization. One Way ANOVA and t-test was applied to determine significance. ∗p < 0.05; ∗∗p < 0.01; ∗∗∗p < 0.001; ∗∗∗∗p < 0.0001. Representative blots are displayed. The whole membranes are depicted in Supplementary Figure 2. (E) ABC cell passages 15, 17, and 19 forming honeycomb like monolayers. (F) Slender cytoplasmic projections (filopodium) in migrating ABC cells are shown in GFP-tagged MFRP overexpressing ABC cells. Monolayer formation. (G) Representation of RPE cells microvilli surrounding photoreceptor. Sections of confluent RPE cells growing on a nitrocellulose filter. Sections through an RPE cell pellet show cells to be about 20 μm wide and 15 μm thick with prominent lateral protrusions (apical villar processes) and a single large central nucleus, resembling the in vivo retinal RPE cell layer. (H) ABC cells seeded on Thincert cell culture inserts treated with vitronectin showing the functional junction formation of ABC cells (Supplementary Figure 4B). (I) ZO-1 staining of ABC cells in culture, one week after plating. The cells are tightly packed. Yellow arrow shows a double nucleated ABC cell. Basal flux was calculated by photometry measurements after subtracting the background and is expressed in absorbance at 560 nm. (J) Immunocytochemistry of ABC cells after 1 week in culture, cells express MITF, beta-catenin, and Peropsin. Blue = DAPI; Red = β-catenin; Green = MITF; Yellow = Peropsin.

