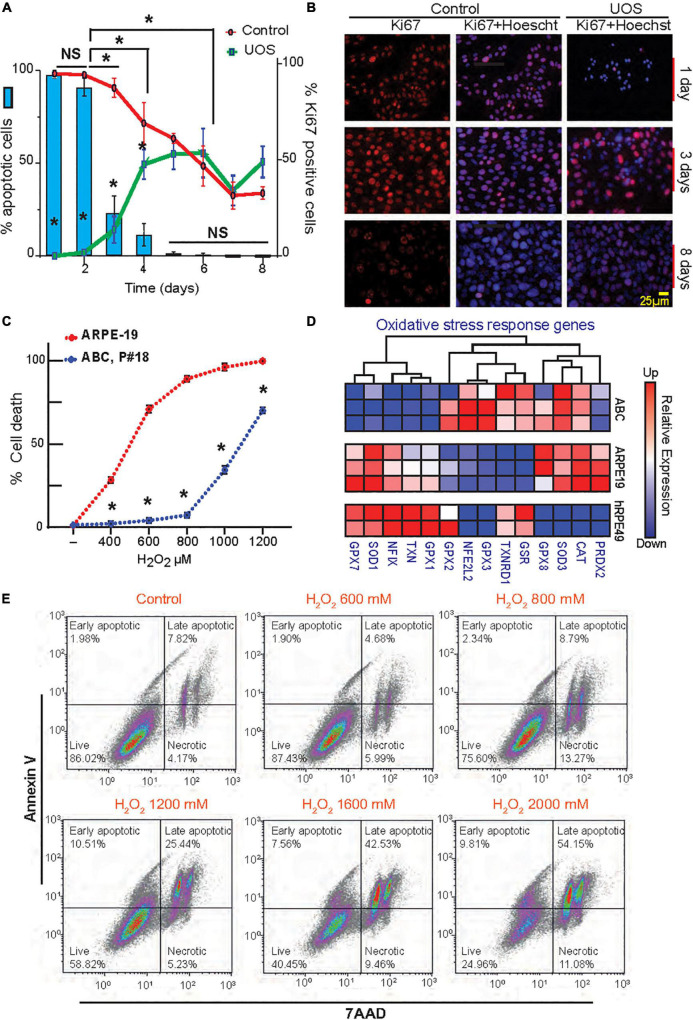
FIGURE 2.
Postmitotic ABC cells become resistant to UOS. (A) The expression of Ki67 in ABC cells is represented by green (UOS) and red (control) lines (right y-axis). Histogram shows cell death rate (left y-axis). (B) Representative images of Ki67 staining in ABC cells at different times. (C) ABC and ARPE-19 cells were exposed to various concentrations of H2O2. Apoptotic cell death was detected by Hoechst staining. Nine cells per well/four wells per condition were plotted. (A,C) Data were analyzed using two-way ANOVA and Tukey’s HSD for pairwise comparisons. *p < 0.05. (D) RNAseq heatmap for expression levels of genes involved in the oxidative stress response for ABC, ARPE-19, and hRPE49 cells. (E) Evaluation of apoptosis and necrosis by flow cytometry relative to the increment in H2O2 concentration. Plots showing Annexin V vs. 7AAD signals were made (Supplementary Figure 4E) (100k events per condition). Four cell populations were analyzed in each experimental condition: 7-AAD+ cells for necrotic cells, 7AAD and Annexin V + cells for Late Apoptotic cells, Annexin V+ for Early apoptotic cells, and live cells negative for both 7AAD and Annexin V. Quadrants show the types of cell death detected differentiated by shape: Early and late apoptosis and necrosis.

