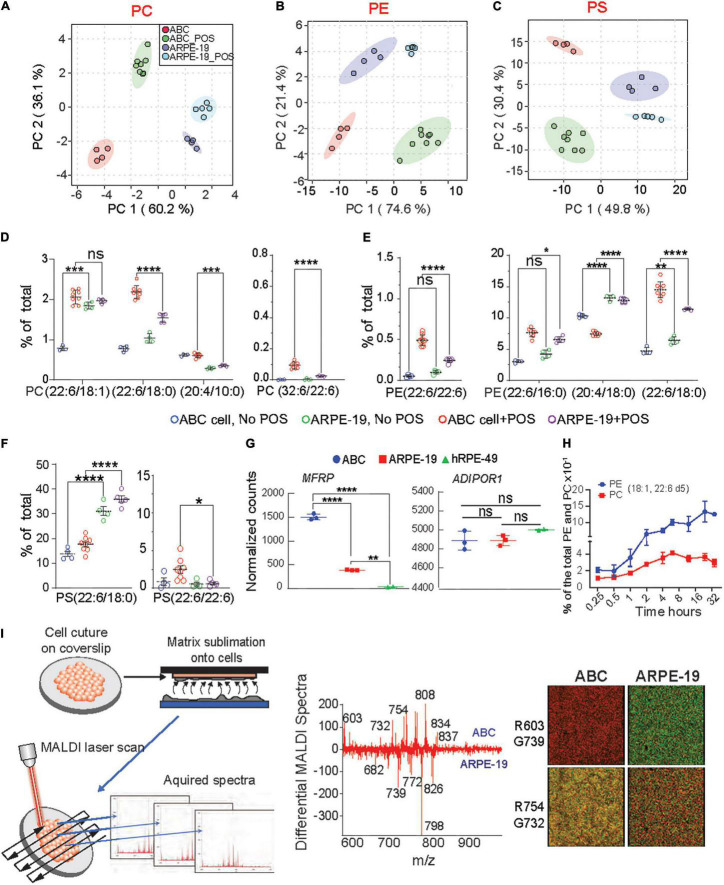
FIGURE 5.
Enhanced incorporation and synthesis of phospholipids containing very-long-chain fatty acids in ABC cells. (A–C) Principle component analysis (PCA) were performed for PC, PE, and PS phospholipid species for ABC cells, and ARPE-19 cells after phagocytosis of POS. (D–F) LC-MS/MS quantitative distributions in bar graphs for ABC vs. ARPE-19 lipid species with and w/o POS feeding shows the most abundant PLs species found in the cells after feeding, containing either DHA and VLC-PUFAs (iv) or double DHA (iii). Tukey’s HSD post hoc testing was performed for two-factor ANOVA ****p < 0.0005, ***p < 0.005, **p < 0.05, *p < 0.01. (G) RNA sequencing analysis showing normalized counts for MFRP and ADIPOR1 gene expression for each cell type. (H) ABC cells fed with deuterated DHA for up to 32 h were analyzed using LC-MS/MS. Line graphs showing two of the most abundant PL species (18:1, 22:6) containing DHA-d5 from ABC cell lysates, demonstrating the ability of the ABC cells to incorporate 22:6. (I) MALDI lipidomic comparative analysis. Coverslips with cells were attached to MALDI plates and then placed within the sublimation chamber, where matrix (2,5-dihydroxybenzoic acid, DHB) was applied for positive ion mode analysis. Sections were then rasterized by laser, 355 nm, 2000 Hz Scanning control (15 μm, horizontal and vertical movement) and analyzed. (Middle panel) Differential spectra show relative abundance of lipid molecular species detected by MALDI IMS based on the cell type. Molecules more abundant in ABC cells are presented in the upper part of the graph, while molecules more abundant in ARPE-19 are displayed at the bottom; m/z 834 corresponding to PC containing DHA (PC (18:0/22:6) was more abundant in ABC cells than in ARPE-19 cells. PC (16:0/18:1) with K + adduct (m/z 798) was the most dominant molecule in ARPE-19. (Right panel) Bicolor (red and green) image composition of lipid signals from MALDI IMS extracted from the cells and generated with positive ion mode. Same m/z shows different abundance from one cell type to another.

