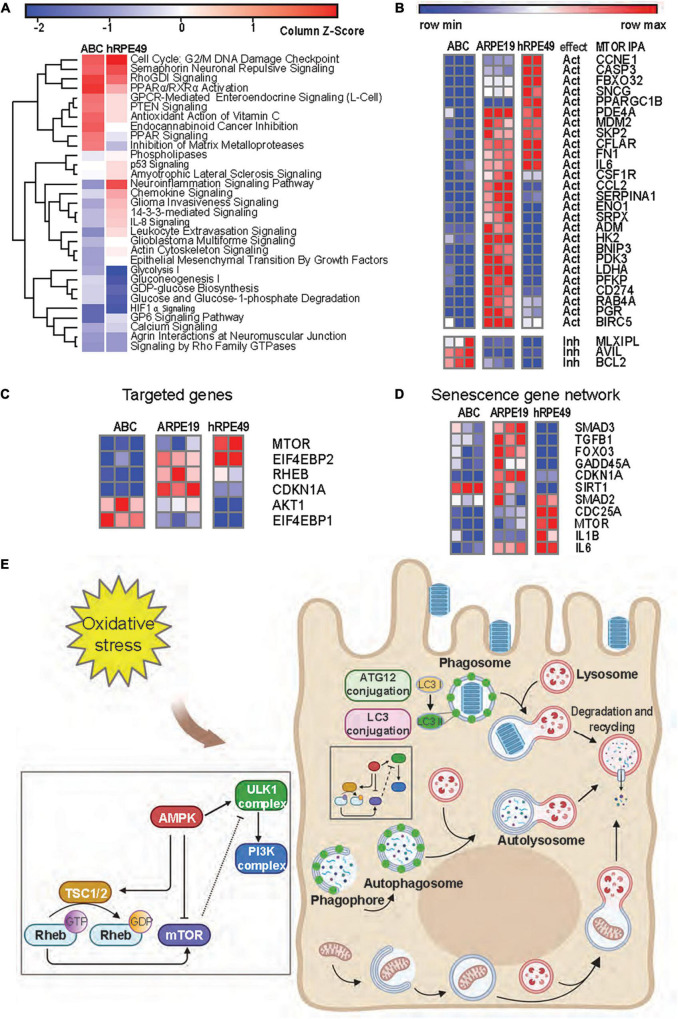
FIGURE 6.
mTOR signaling is reduced in ABC cells as compared to ARPE-19 cells. (A) Heatmap from RNA seq analysis of ARPE-19 cells compared to ABC and hRPE49 cells showing canonical pathways with the most significant changes. IPA analysis was performed using ARPE-19 cells as control. Red color means the pathway is upregulated when compared with ARPE19, while blue means it is downregulated. (B) Comparative heatmap representation of RNA seq data of mTOR downstream signaling genes (Supplementary Figure 10 shows IPA network). The expected effect of mTOR on its downstream targets is labeled as “Act” for activation and “Inh” for inhibition. (C) Analysis of genes involved in geroconversion and autophagy activation by mTOR signaling and its related genes. (D) Heatmap analysis of genes involved in senescence. (E) Autophagy pathways in RPE cells.

