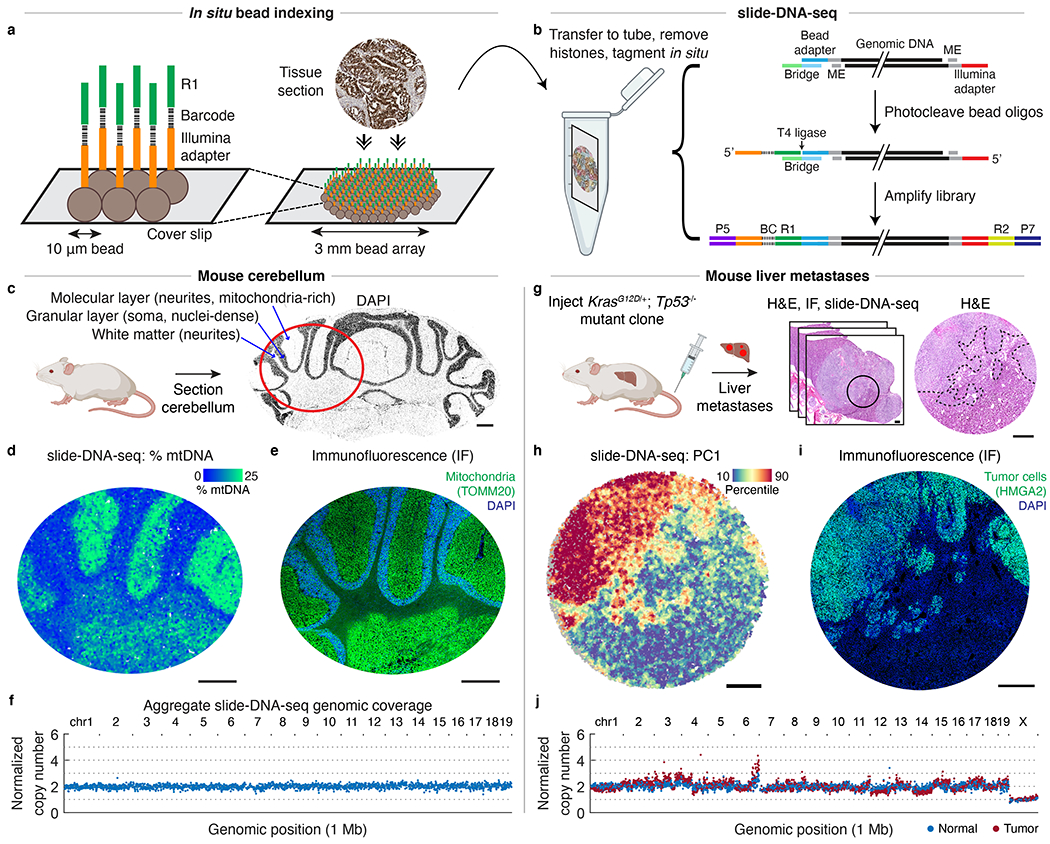
Fig. 1: slide-DNA-seq enables spatially-resolved DNA sequencing.

a, Schematic of in situ bead indexing. Array of randomly-deposited beads is spatially indexed through in situ sequencing of DNA barcodes. Fresh-frozen tissue is cryosectioned onto array. b, Schematic of slide-DNA-seq library construction. Genomic DNA is transposed with Tn5. Hybridization of a bridge oligo allows ligation of photocleaved, spatially-indexed bead oligos to genomic fragments. ME, mosaic ends; BC, barcode; R1, Illumina read 1; R2, Illumina read 2. c, DAPI stained cryosection of a mouse cerebellum. Red circle indicates approximate region shown in d and e. d, slide-DNA-seq of a cerebellar section with beads colored by percentage of fragments aligned to mitochondrial genome. e, Serial section to d stained with DAPI and antibody against mitochondrial protein TOMM20. f, Normalized copy number per 1 Mb genomic bin for aggregated beads from d. g, Serial sections from KrasG12D/+; Tp53−/− liver metastases were processed for H&E staining (center, circle indicates region analyzed; right, dotted lines indicate tumor boundary), slide-DNA-seq (h), and IF against HMGA2 (i). h, slide-DNA-seq of mouse liver section with beads colored by principal component 1 scores (PC1). For visualization, scores for each bead are smoothed by 50 PC neighbors and 10 spatial neighbors (36 μm diameter). i, Serial section to h stained with DAPI and antibody against tumor marker HMGA2 . j, Normalized copy number per 1 Mb genomic bin for aggregated normal and tumor beads from liver section from h. Scale bars, 500 μm. Grey beads shown for spatial context but excluded from analysis.
