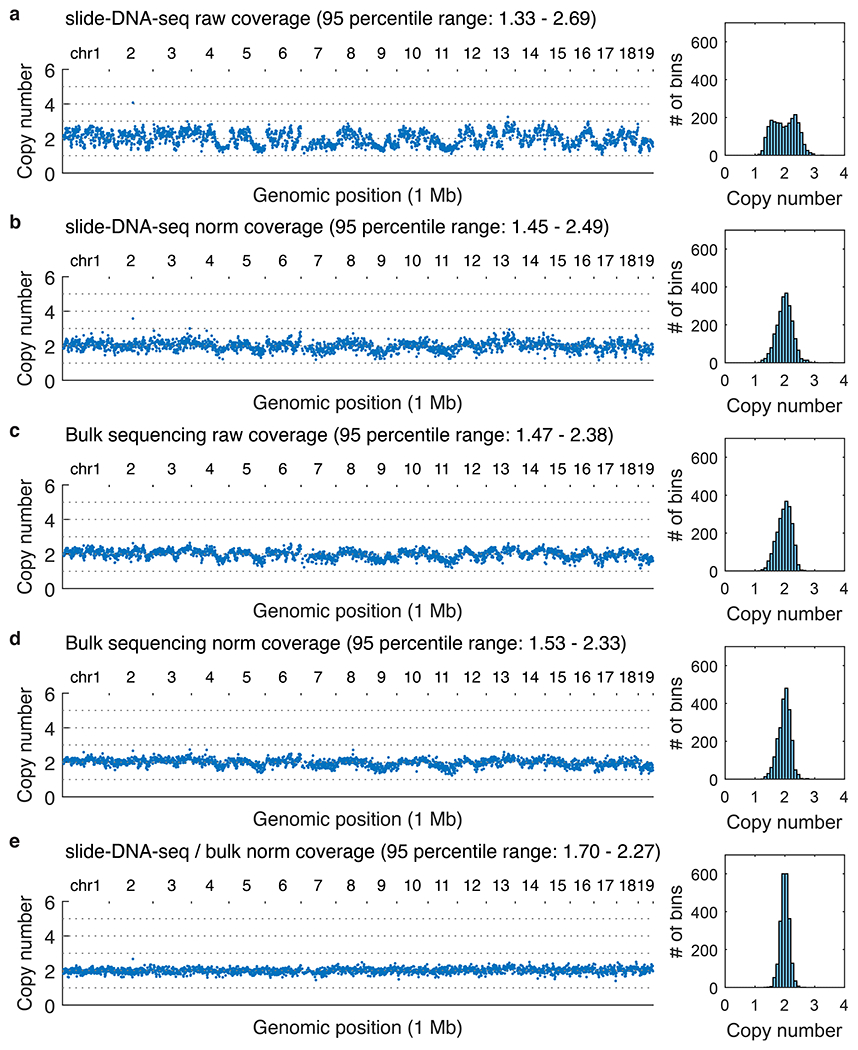
Extended Data Figure 6: Quantification of genomic coverage in a diploid sample.

Left (all panels), copy number profiles at 1 Mb genomic resolution of the mouse cerebellum for the sequencing modality and processing indicated. For this diploid sample, each copy number distribution is normalized to a median of 2. Right (all panels), histogram of the number of bins per copy number. a, Raw coverage profile of slide-DNA-seq. b, Coverage profile of slide-DNA-seq normalized by GC-content and mappability. c, Coverage profile for bulk tagmentation-based sequencing. d, Coverage profile of bulk sequencing normalized by GC-content and mappability. e, Coverage profile of slide-DNA-seq normalized by the GC-content and mappability divided by bulk sequencing normalized by GC-content and mappability.
