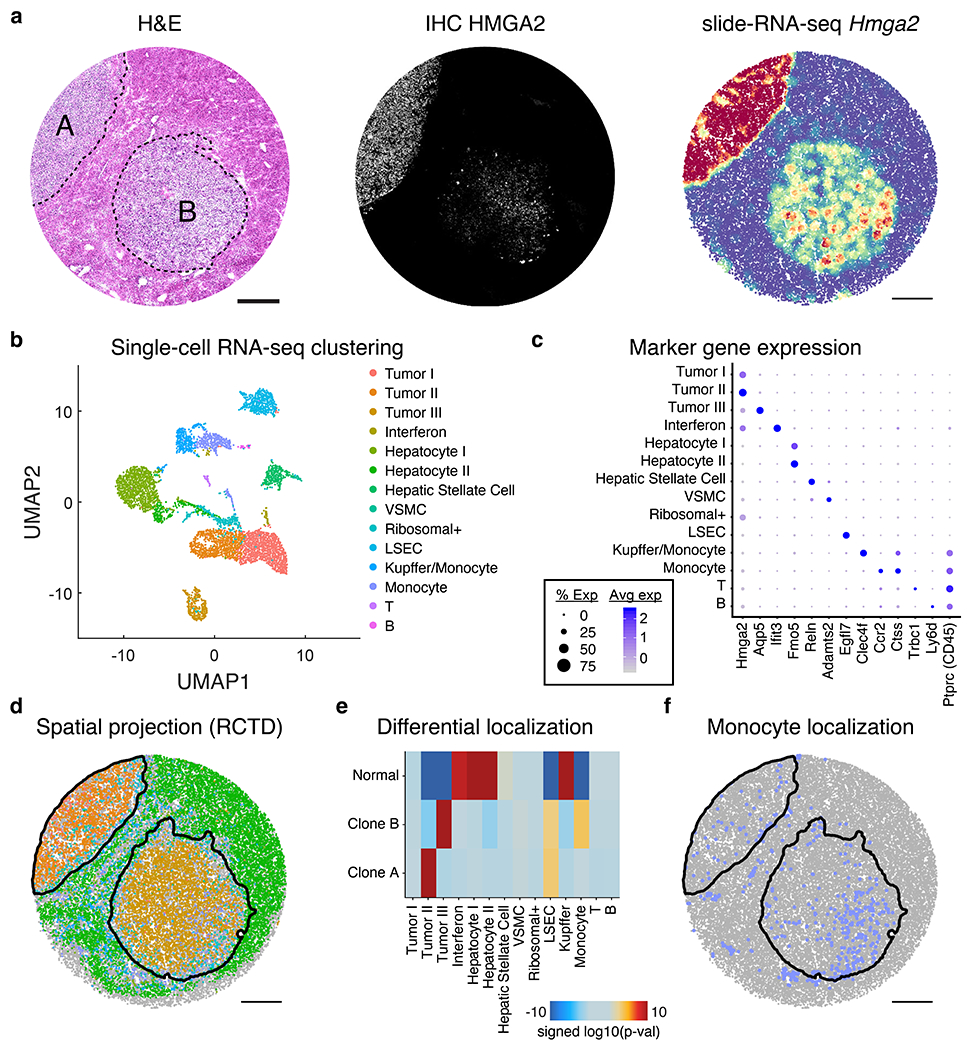
Extended Data Figure 11: Integrated slide-RNA-seq and single-nucleus RNA-seq analysis of clones.

a, H&E stain (left), IHC against tumor marker HMGA2 (center), and Hmga2 expression from slide-RNA-seq (right) of three serial sections of mouse liver metastases. b, UMAP of unsupervised clustering of single nucleus RNA-seq performed on nuclei from mouse liver metastasis sample. c, Dot plot showing the expression of marker genes used to annotate clusters in b. d, Spatial projection of cell types from b onto the slide-RNA-seq array, colored in the same fashion. Black lines indicate spatial tumor clusters. e, Differential localization of cell types between clone A, clone B and normal regions. Heatmap shows signed (positive, enrichment; negative, depletion) log10(p-value) from permutation testing (two-sided, not adjusted for multiple comparisons). f, Spatial plot of monocyte localization on the array, which is significantly enriched for clone B. Black lines indicate spatial tumor clusters. VSMC, vascular smooth muscle cell; LSEC, liver sinusoidal endothelial cells.
