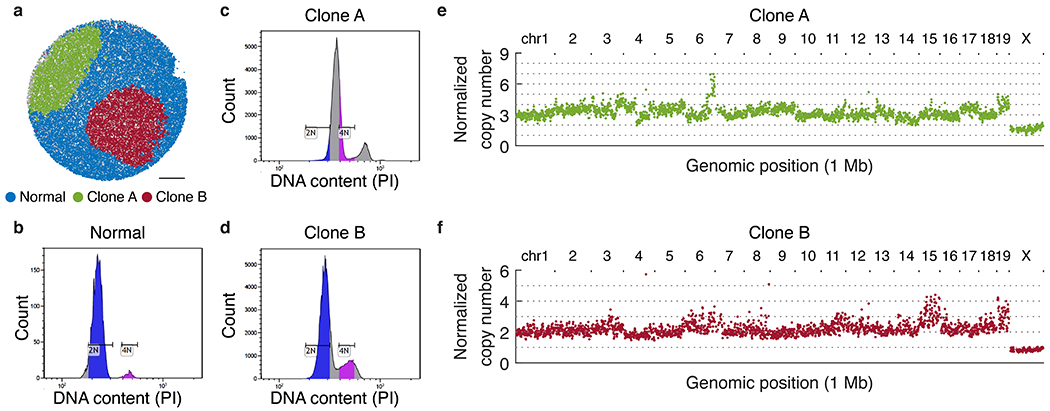
Extended Data Figure 12: Validation of ploidy and copy number of metastatic clones.

a, Assignment of beads to normal tissue, clone A, and clone B based on k-means clustering. b-d, Histogram of DNA content of single cells measured by propidium iodide (PI) fluorescence intensity through flow cytometry. (b) bone marrow cells (normal control); (c) clone A; (d) clone B. Diploid G1 (2N) and G2 (4N) gates are determined on bone marrow histogram and applied to clones A and B, revealing that the clone A genome is triploid; and the clone B genome is diploid with some amplifications (e.g. of chr. 15 and 19, see Fig. 2d). e, Aggregate copy number profiles of beads assigned to clone A. f, Aggregate copy number profiles of beads assigned to clone B.
