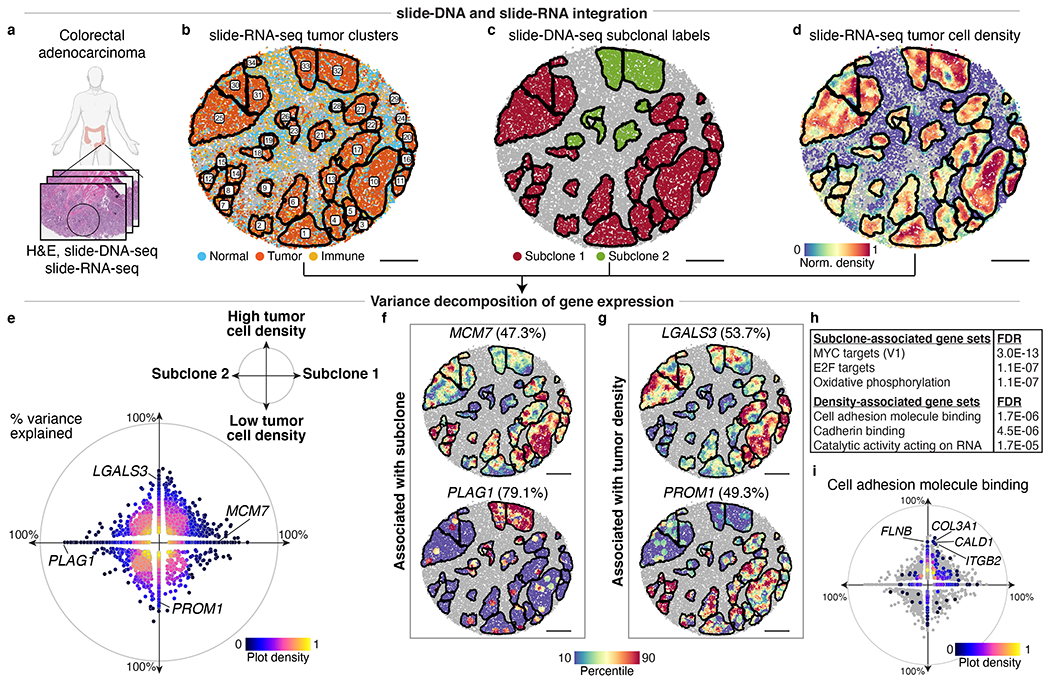
Fig. 4: Decomposition of transcriptional programs driven by genetic aberrations and tumor density.

a, Serial sections from nearby region of human colorectal tumor from Fig. 3 were processed for H&E staining, slide-DNA-seq (Extended Data Fig. 14), and slide-RNA-seq (b-j) b, slide-RNA-seq of colon tumor section with beads colored by assignment to normal, tumor, or immune clusters. Black lines denote boundaries of spatially-distinct tumor regions. c, Subclone labels for spatial tumor regions (defined via co-registration with slide-DNA-seq serial section) plotted on slide-RNA-seq array from b. d, Tumor density plotted on slide-RNA-seq array from b. e, Genes plotted by percent variance explained by subclone (x-axis) and/or tumor density (y-axis), colored by plot density (n=2,148, stepwise regression, p<0.05). f, Top subclone-associated genes, with expression plotted for spatial tumor regions. g, Same as f but for top density-associated genes. h, Select gene sets significantly associated with either subclone or tumor density. i, Cell adhesion molecule binding genes (n=544) plotted by percent variance explained by subclone (x-axis) and tumor density (y-axis), colored by plot density. All other genes from e shown in grey. Scale bars, 500 μm. Grey beads shown for spatial context but excluded from analysis.
