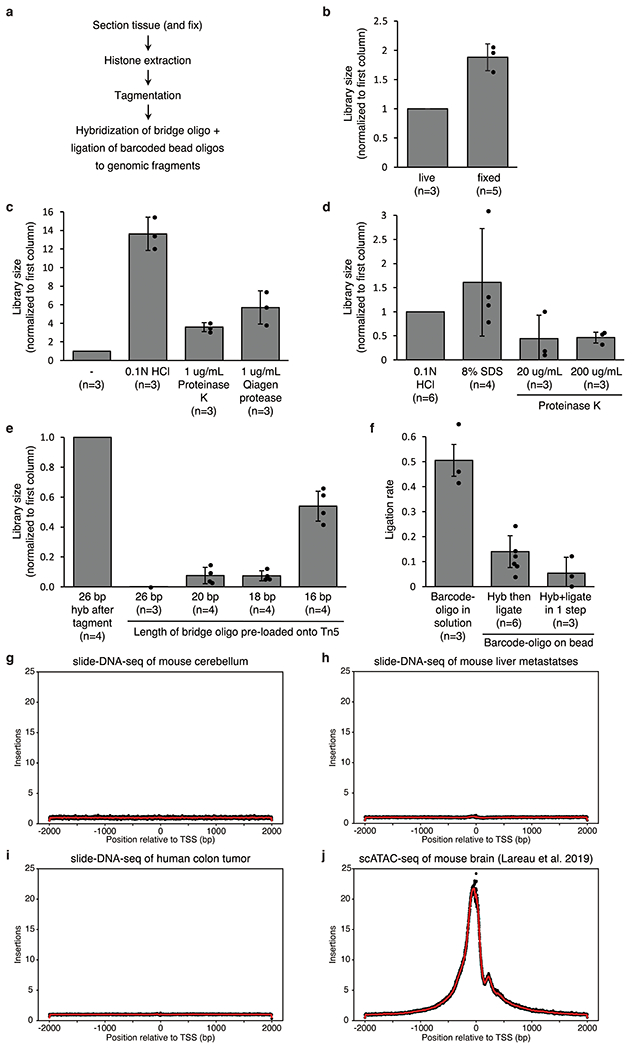
Extended Data Figure 1: Optimization of slide-DNA-seq protocol.

a, Library preparation steps. b-e, Library size comparisons for live vs fixed tissue (b); histone extraction protocols (c-d); and varying lengths of a bridge oligo used to connect the barcoded bead oligo to genomic fragments e, either hybridized after tagmentation (left bar) or pre-loaded onto the Tn5 transposase prior to tagmentation (rest). All values are normalized to control condition (first column). f, Rate of ligation of genomic fragments to barcoded oligo either ordered in solution from IDT (left) or cleaved off from beads (center, right). g-j, Frequency of Tn5 insertions in the genome relative to the nearest transcription start site (TSS) for slide-DNA-seq of mouse cerebellum (g), mouse liver metastases (h), human colon tumor (i), and for single-cell ATAC-seq of a mouse brain (j). Error bars, mean ± s.d; n, number of replicate comparisons (generated from 4 biological samples); dots represent values of each replicate.
