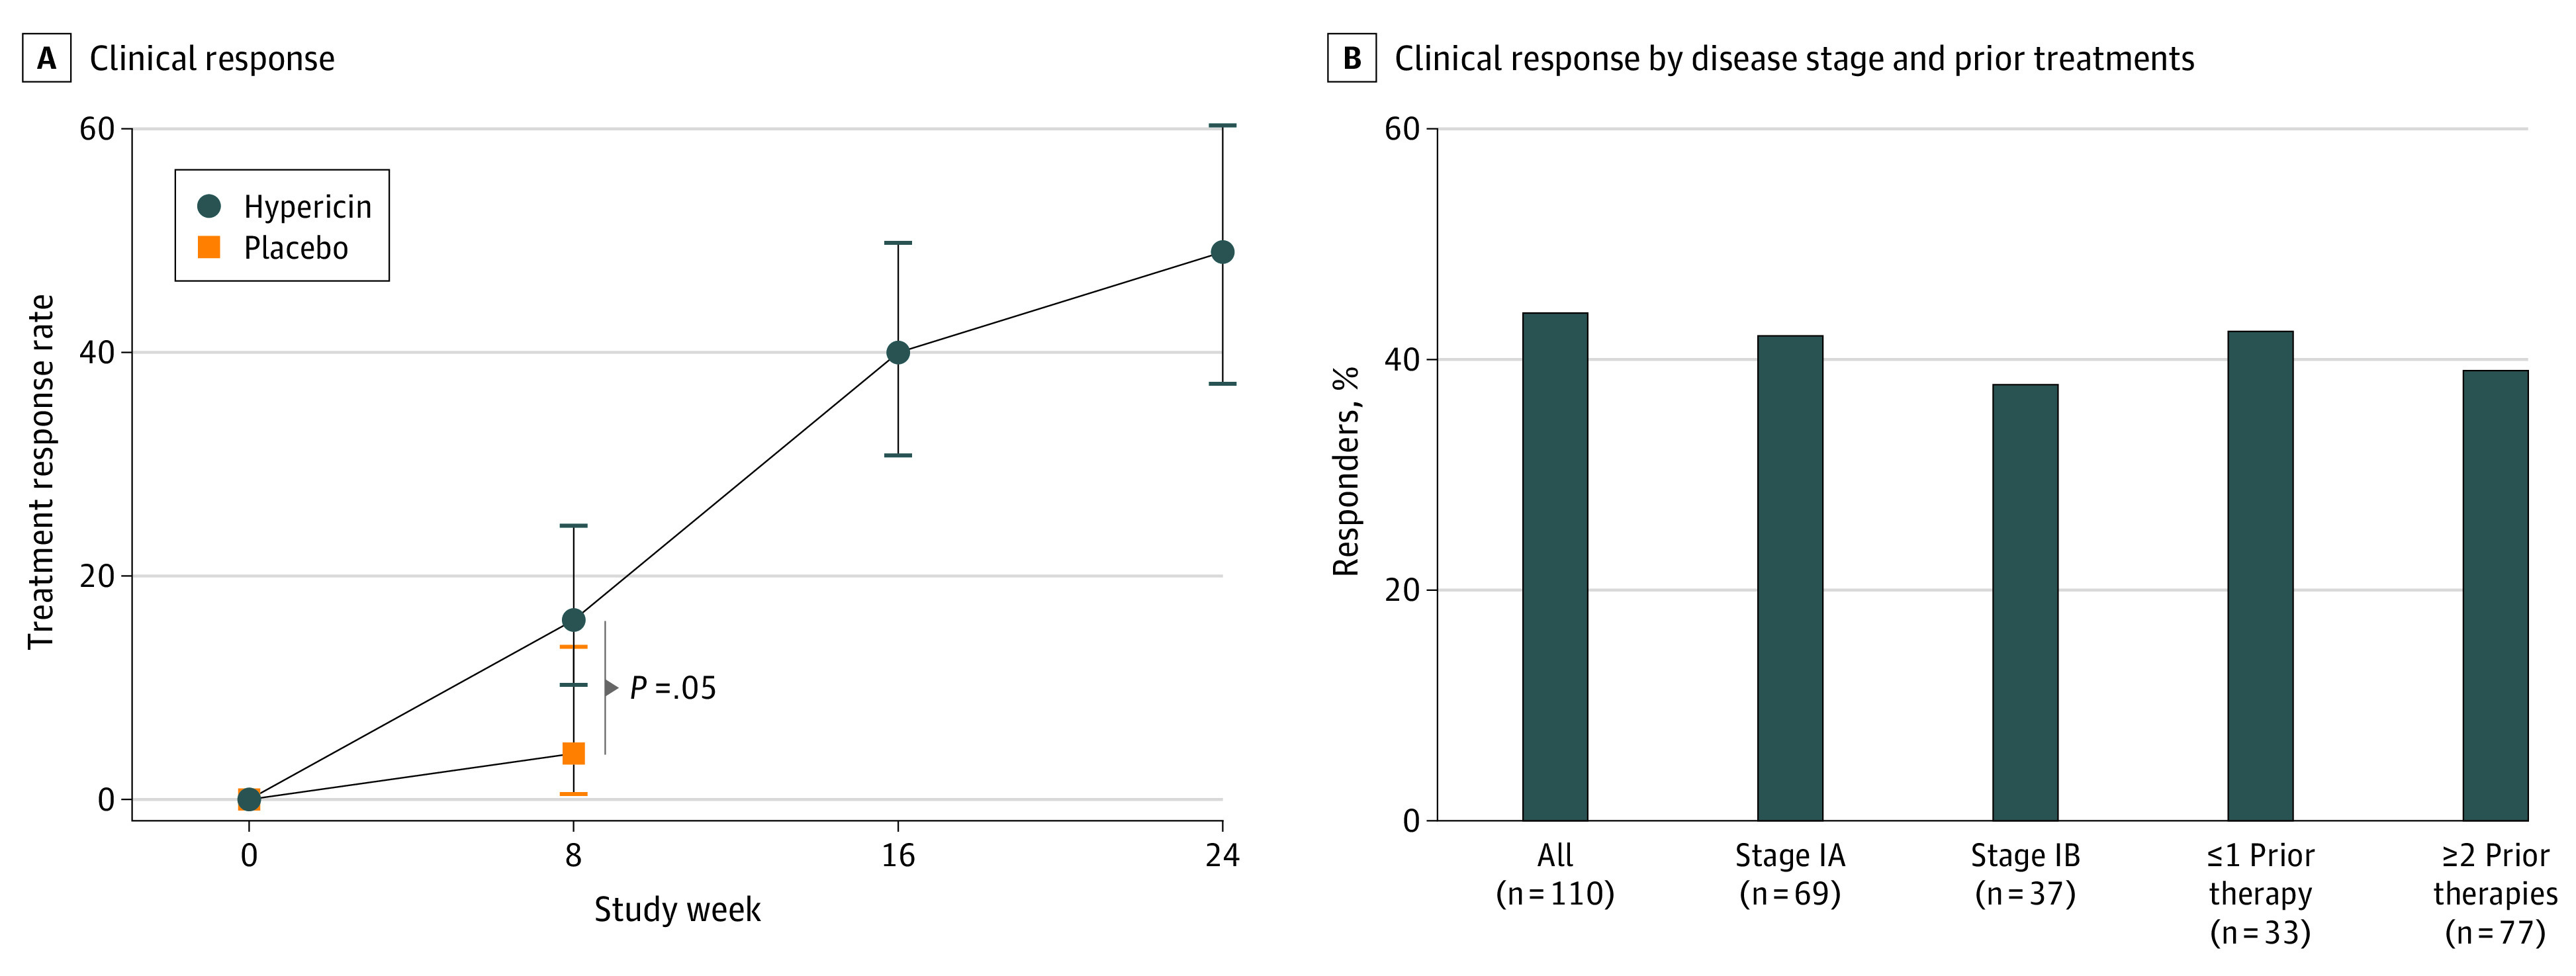
Figure 2. Clinical Responses to Hypericin PDT, by Treatment Time, Disease Stage, and Prior Therapy.

A, Week 8 represents the patient outcomes of cycle 1 with hypericin PDT (n = 116) or placebo (n = 50) for 6 wks plus a 2-wk rest period before evaluation; week 16, outcomes for patients who received hypericin PDT in cycle 1 and for 6 wks in cycle 2 (n = 44 of 110) plus another 2-wk rest; and week 24, outcomes for patients who received hypericin PDT in cycles 1 and 2 and continued with optional cycle 3 (n = 38 of 78) plus a 2-wk rest. The statistical significance of the RR comparison at the end of cycle 1 was calculated by logistic regression describing responder status when ≥50% improvement in cumulative mCAILS scores from baseline was seen as a function of treatment assignment and baseline mCAILS score. Errors bars describe the 95% CIs using the method of Clopper-Pearson. RRs in cycle 2 for patients who initially received placebo in cycle 1 (22%) were similar to the RRs in the patients receiving hypericin PDT in cycle 1 (16%); data not shown. B, Treatment RRs after 16 wk of hypericin PDT for patients receiving hypericin PDT in both cycles 1 and 2, as a function of disease stage (stages IA and IB; owing to small sample size, stage IIA data are not included) and previous CTCL therapy. Treatment RR was similar across these defined subpopulations. CTCL refers to cutaneous T-cell lymphoma; mCAILS, modified Composite Assessment of Index Lesion Severity; PDT, photodynamic therapy; and RRs, response rates.
