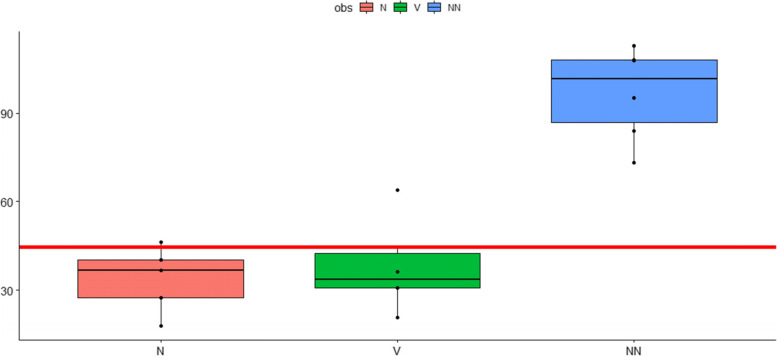
Fig. 3.
Reserve capacity oxygen consumption rates (OCR). Reserve capacity OCR in pmol O2/min were measured before, after the first 10-pass OHT and after the second 10-pass OHT one week later. Cumulative data from six patients expressed as mean ± s.e.m. P-values: 0,0,000,567 (NN versus V); 0,614 (N versus V); 0,0,000,308 (N versus NN). COHEN: 3,84,696 (NN versus V); 0,3,071,484 (N versus V); 4,552,083 (N versus NN). ANOVA: 0,0,000,137 (NN versus V); 0,8,829,582 (N versus V); 0,000,011 (N versus NN). V: before OHT; N: after the first OHT; NN: after the 2. OHT (one week later). Y-Axis: pmol O2/min; X-axis: sampling time

