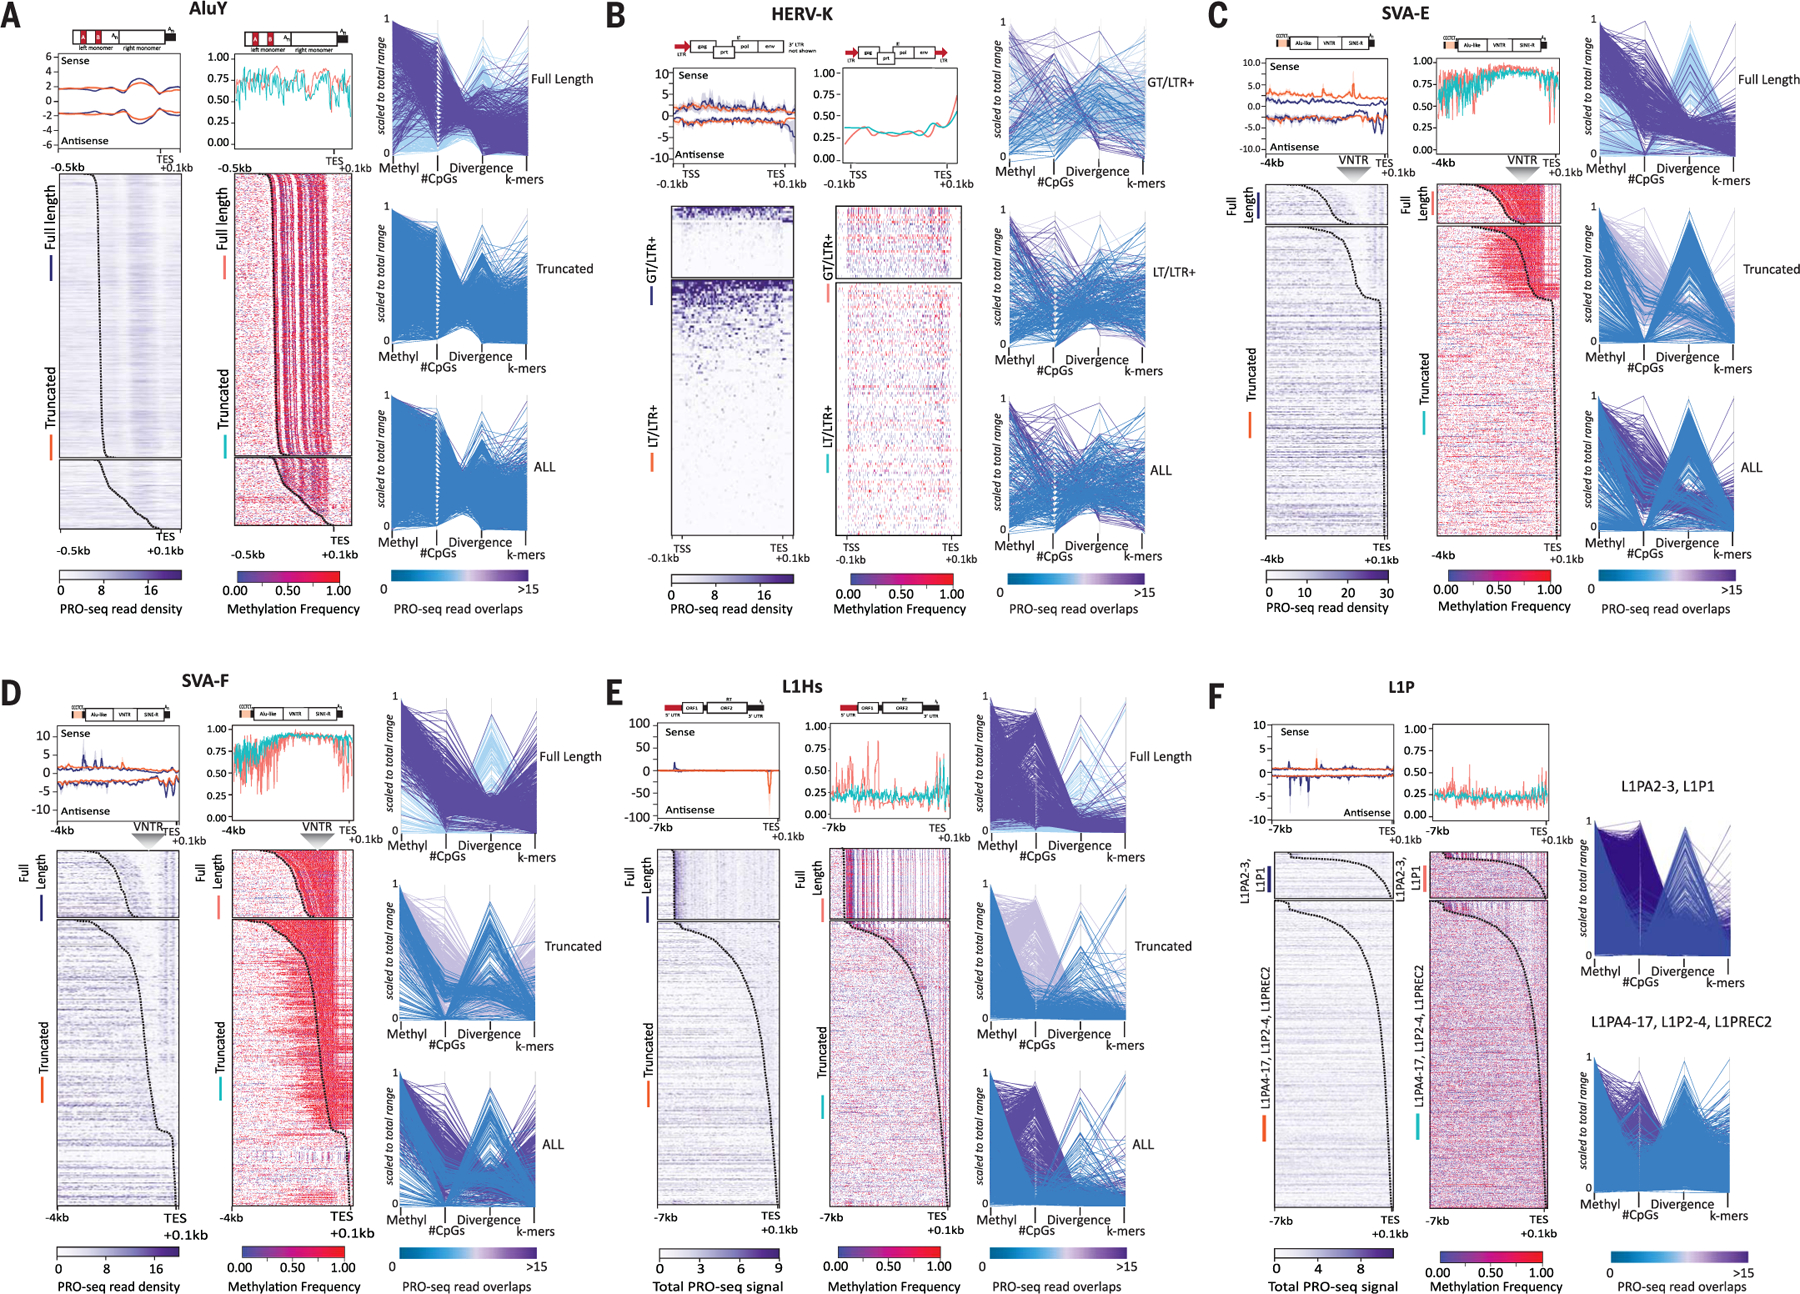
Fig. 2. Transcriptional profiles of TEs are highly correlated with sequence divergence and epigenetic features.

(A to F) RNA polymerase occupancy, methylation levels, CpGs, and divergence for (A) AluY, (B) HERV-K, (C) SVA-E, (D) SVA-F, (E) L1Hs, and (F) L1P elements from CHM13. Heatmaps of (left panel) T2T-CHM13 PRO-seq density (Bowtie2 default “best match,” purple scale) and average profiles showing sense and antisense strands (upper panels, standard error shown in gray) and (right panel) methylated CpGs (red–purple scale, aggregated frequency per site) for TEs grouped by their length [(A) to (E)] [fulllength (FL) and truncated (TR)] or L1PA subfamily [(F), all truncated)]. HERV-K groups are delineated as follows: >7500 bp elements (GT) and <7500 bp elements (LT) with both 5′ and 3′ long-terminal repeats (LTR+). (HERV-K elements with only one or no LTR are shown in fig. S18C). Both GT and LT/LTR+ HERV-K elements are scaled. All other TEs are anchored to the 3′ end, with a specified distance from the anchor (bottom left). Standard error for composite (gray), TSS (transcription start site), TES (transcription end site), location of the VNTR (variable number tandem repeat) within SVA are indicated. A dotted line is included on the heatmap denoting the static −0.1 kbp from the end of the annotated element. Representative schematic of elements and respective subcomponents are shown above the composite profile, scaled to the TES; red blocks indicate previously known promoter regions. (Right side of each panel) Parallel plots for each TE are shown, highlighting each group of TEs (FL/TR, or L1P subfamily; HERV-K plots represent LTRs only). Vertical axes represent scaled values for average methylation, number of CpG sites, and divergence from RepeatMasker consensus sequences for each instance of the element. Coloration by the number of overlapping PRO-Seq reads where purple represents the highest read overlap and blue the lowest, on the scale matching each plot.
