
Fig. 3. Transcriptional, epigenetic, and structural differences define SST1 elements across the human genome.
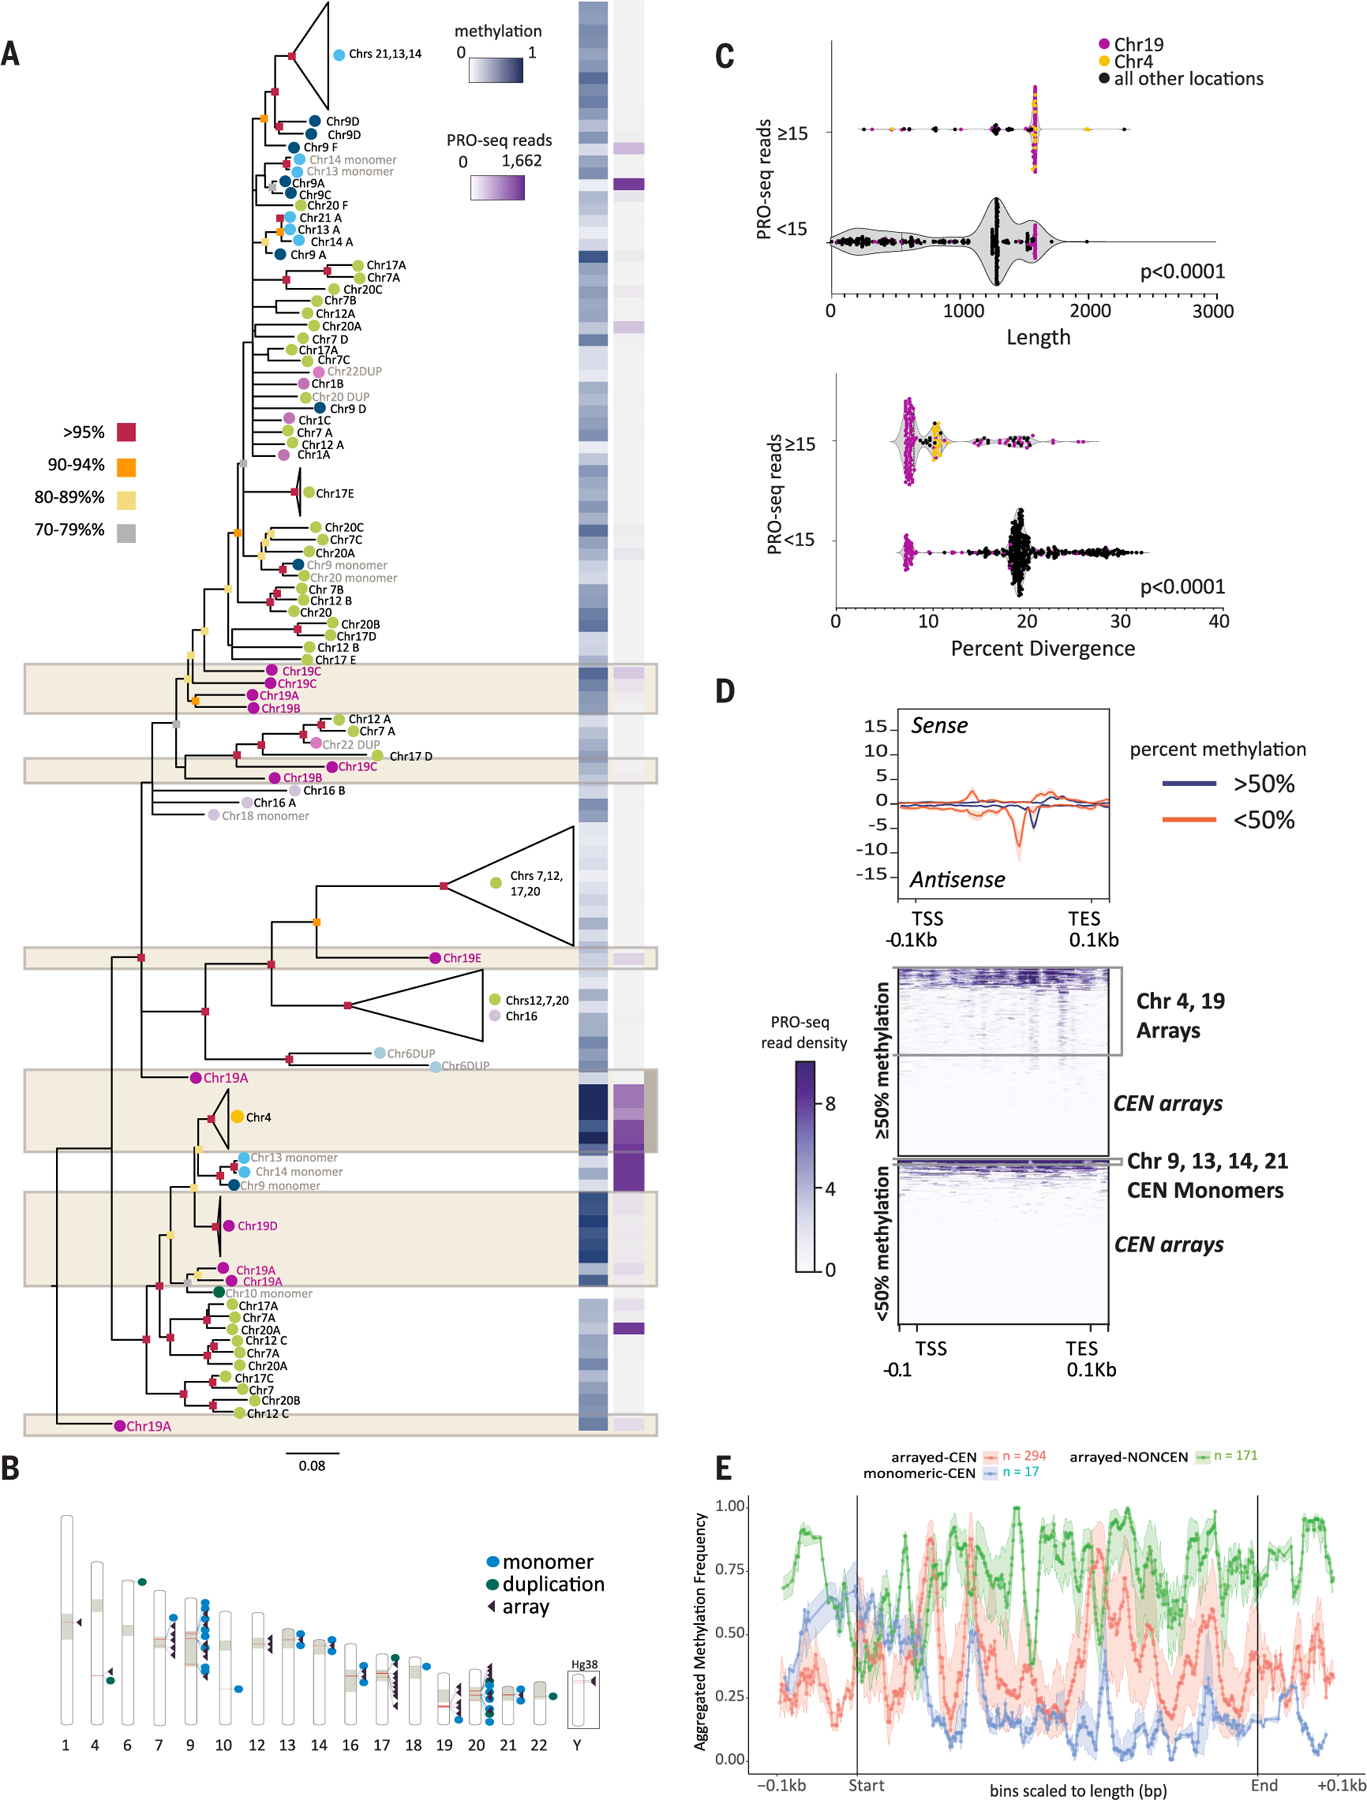
(A) RAxML phylogenetic analysis of SST1 elements [subsampled to represent each chromosomal location and aligned using MAFFT (107)] (tables S14 to S17). Bootstrap values are indicated by color (as per key to the left) at the base of each node. Branch lengths indicate distances and unresolved nodes were collapsed. “Chr#” followed by letters A to F indicates the array designation by T2T-CHM13 chromosome unless SST1 is present as a monomer or as duplicons (DUP) (indicated in gray text). Colored circles by chromosome labels indicate phylogenetic clusters (e.g., chromosomes 7, 12, 17, and 20 in green and chromosomes 13, 14, and 21 in aqua). (Right) For each SST1 sequence or group of collapsed sequences on the tree, average methylation frequency (0, hypomethylated; 1, hypermethylated) is indicated in blue, and PRO-seq read coverage is indicated in purple as per key inset. Tan boxes denote noncentromeric arrays. (B) The location of SST1 elements across T2T-CHM13 is indicated by red bars within the chromosome schematic (table S14). Tan blocks indicate centromeres and centromere transition regions as per (12). SST1 arrangement as a single monomer (blue dot), duplication (green dot), or array (purple triangle) is indicated. Locations of SST1 arrays on the Y chromosome are shown for GRCh38 (CHM13 is 46,XX). (C) Violin plot of SST1 elements shows statistically significant differences between expression levels (repeat overlap of PRO-seq reads, Bowtie2 default “best match”) and length of the element (t test, P < 0.0001) as well as percent divergence (t test, P < 0.0001). Dot colors indicate interstitial arrays on chromosome 19 (purple) and chromosome 4 (yellow) with a read overlap higher than 15. All other locations with a read overlap lower than 15 are indicated in black. Fifteen read overlap cutoffs determined by analyzing the range of read overlap among all SST1s (fig. S23). (D) T2T-CHM13 PRO-seq profiles (Bowtie2 default “best match,” upper panel) of SST1 grouped by average methylation levels (<50% and > 50%). Each element is scaled to a fixed size with standard error shading (gray), TSS, TES, and ±0.1 kbp are shown (bottom). Heatmaps (lower panels) of PRO-seq density (purple scale, normalized reads per million aggregate for sense and antisense) grouped by average methylation levels (>50%, top; <50%, bottom). Clusters of specific SST1 loci are indicated to the right. (E) Metaplot of aggregated methylation frequency (100 bins total) of SST1 elements (500 bp to 2 kbp), ±0.1 kbp, grouped by chromosomal location and arrayed versus monomeric or duplicated [orange, centromeric (CEN) array; blue, centromeric monomer; green, noncentromeric array]. Truncated noncentromeric/CEN monomers and duplications not shown; length filtering resulted in n = 1.