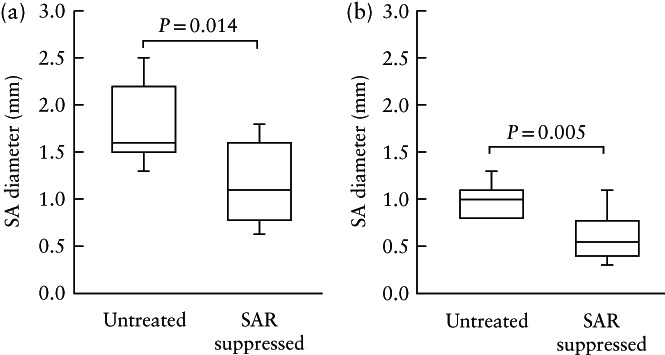
Figure 3.

Box‐and‐whiskers plots showing spiral artery (SA) diameter in systole (a) and in diastole (b), as quantified by B‐flow/STIC M‐mode ultrasonography, on day 60 of gestation in seven untreated and 12 spiral artery remodeling (SAR)‐suppressed baboons. Boxes are median and interquartile range and whiskers are range. In (b), the lowest value (0.8 mm) in the untreated group is also the first quartile (which is why there is no whisker).
