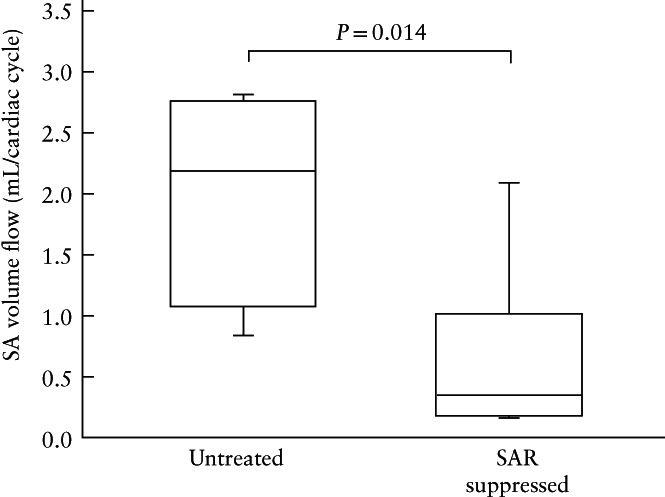
Figure 5.

Box‐and‐whiskers plots showing spiral artery (SA) volume flow as quantified by B‐flow/STIC M‐mode ultrasonography on day 60 of gestation, in four untreated and eight spiral artery remodeling (SAR)‐suppressed baboons. Boxes are median and interquartile range and whiskers are range.
