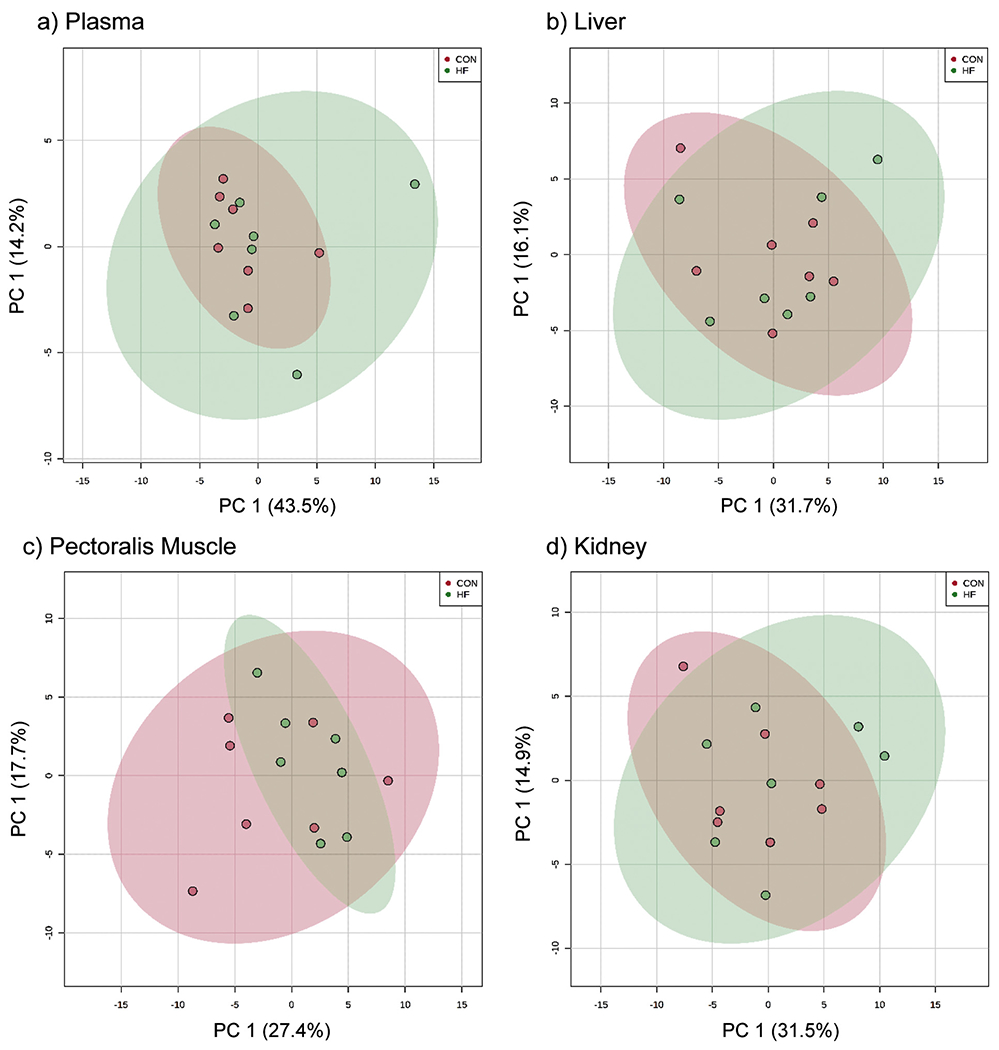
Fig. 1.

Principal Component Analysis (PCA) score plats of mourning dove plasma, liver, pectoralis muscle, and kidney show minimal separation between diet groups. PCA score plots produced via online MetaboAnalyst.ca software for plasma (number of metabolites matched to program: n = 63/71), liver (n = 138/151), pectoralis muscle (n = 145/159), and kidney (n = 167/187) between mourning doves consuming a four-week high-fat diet (HF: red circles, n = 7) or control diet (CON: green circles, n = 7). PCA X and Y Axis are principal components (PC) 1 and 2, respectively, and represent the first and second largest variation in the data. The values on the X and Y axis represent the percentage of variation explained by the PC. Note: X and Y axis vary by plot. (For interpretation of the references to colour in this figure legend, the reader is referred to the web version of this article.)
