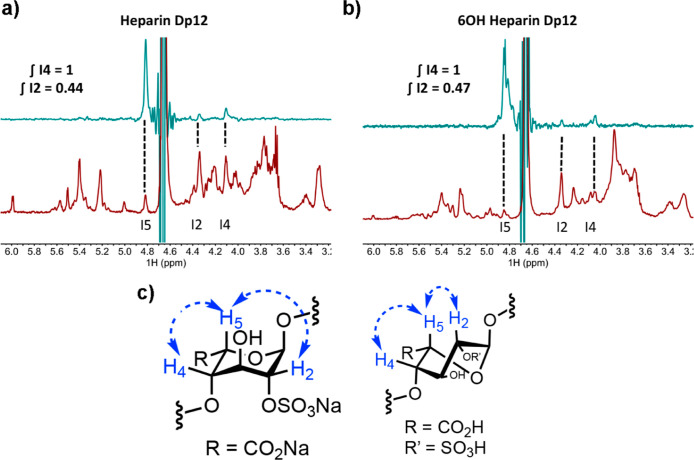
Figure 3.
(a) Bottom, 1H NMR spectrum for heparin Dp12; top, selective 1D NOESY (irradiation of I5) with positions 5, 2, and 4 assigned; (b) bottom, 1H NMR spectrum for 6OH Dp12; top, selective 1D NOESY (irradiation of I5) with positions 5, 2, and 4 assigned; and (c) conformers 1C4 and 2S0 for IdoA2S residues which indicate distances between H2 and H5, and H4 and H5, displayed with dotted arrows.

