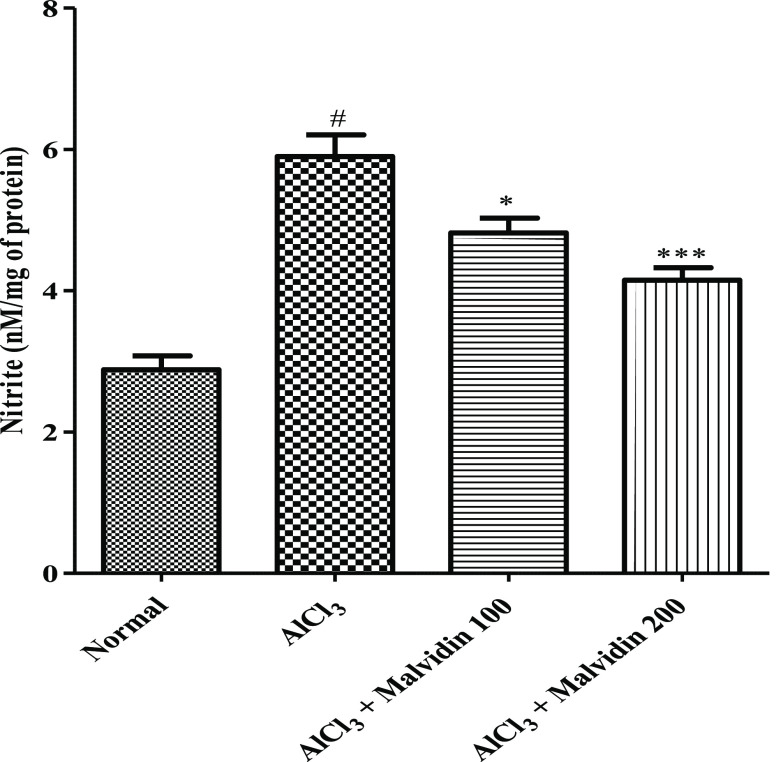
Figure 6.
Effect on nitrite content of malvidin in aluminum-exposed rats. All values are expressed as mean ± SD (p value < 0.05 and 0.001 are expressed as * and ***, respectively, when compared with the disease control group); # significant as compared to the normal control group (p < 0.001). Correlation among the groups was obtained using one-way ANOVA, followed by Tukey’s test.

