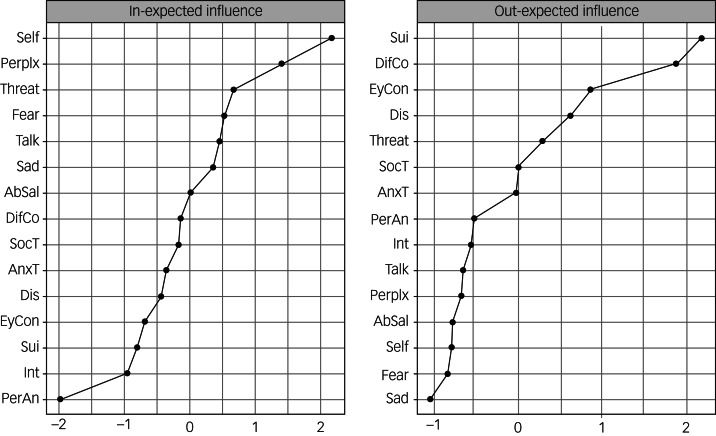
Fig. 2.
Cross-lagged centrality plots of out-expected influence and in-expected influence. The nodes are denoted on the y-axis and the standardised centrality coefficients are denoted on the x-axis. Higher z-scores indicate higher centrality. Because of the low stability, out-expected influence should not be interpreted. AbSal, aberrant salience; AnxT, anxious tension; DifCo, difficulty mixing with co-workers; Talk, difficulty talking with others; Dis, difficulty disagreeing; EyCon, difficulty making eye contact; Int, interest; PerAn, perceptual anomalies; Perplx, perplexity, lack of natural evidence; Self, self-view; Sui, suicidal ideation; SocT, social tension; Threat, feeling threatened or paranoid.

