
Fig. 2. Enrichment of Treg, Trm, and exhausted CD8+T cell populations in rash-affected skin.
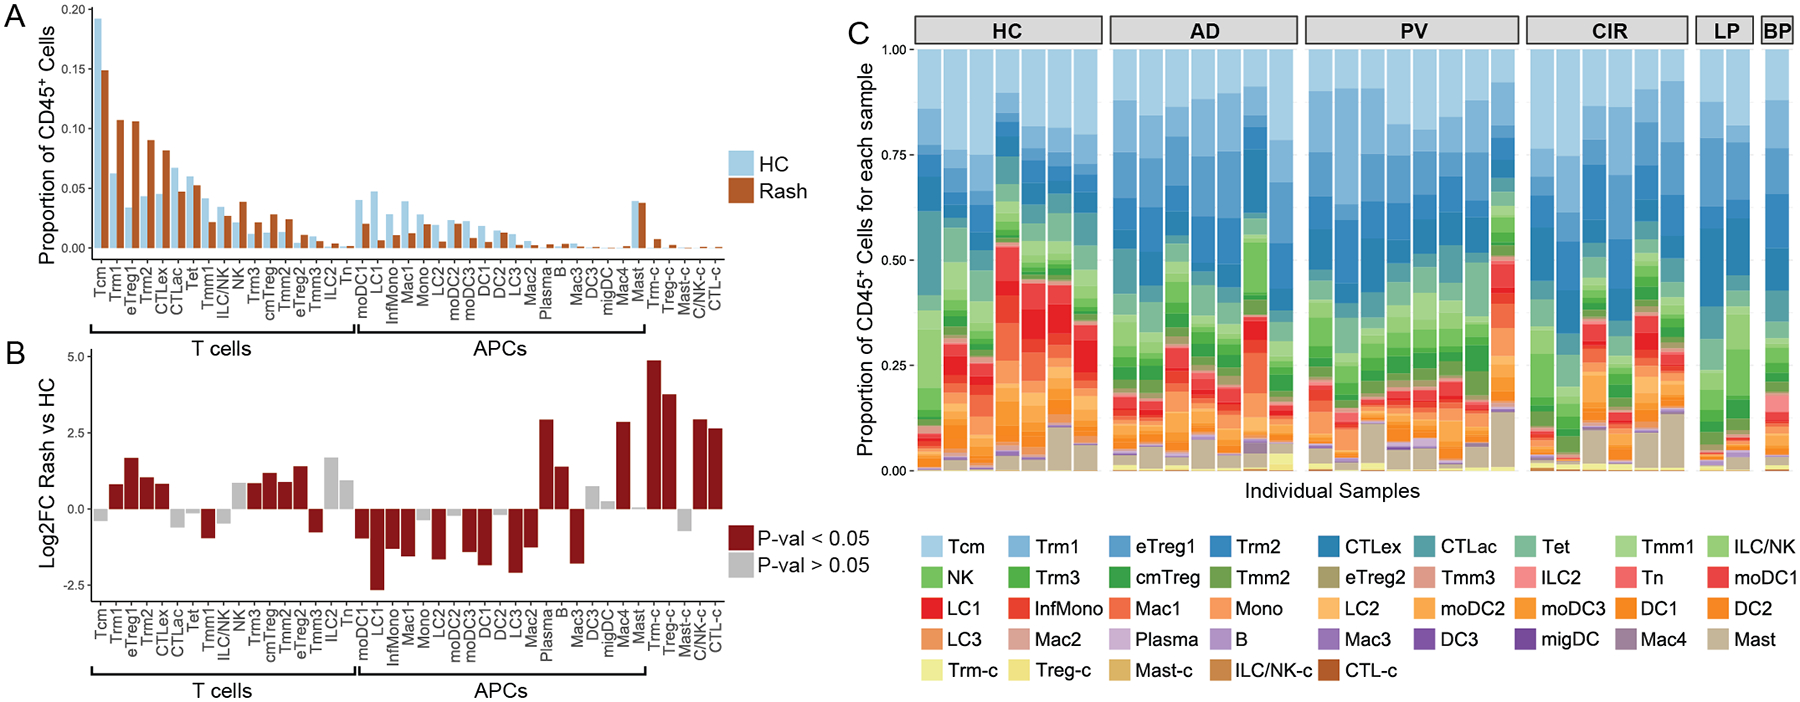
A) Distribution of immune cell populations for 7 healthy control (HC) and 24 rash-affected (Rash) skin samples. X-axis represents different immune cell populations. Y-axis represents proportion of CD45+ immune cells for each immune cell population in either rash-affected or normal skin. B) Quasi-binomial model Log2 fold change for rash-affected versus healthy control skin (Y-axis). X-axis represents different immune cell populations. Unpaired two sample t-test was used. Red colored bars indicate statistically significant changes (p-value < 0.05). C) Proportion of cells in each CD45+ immune cell population for each individual sample.