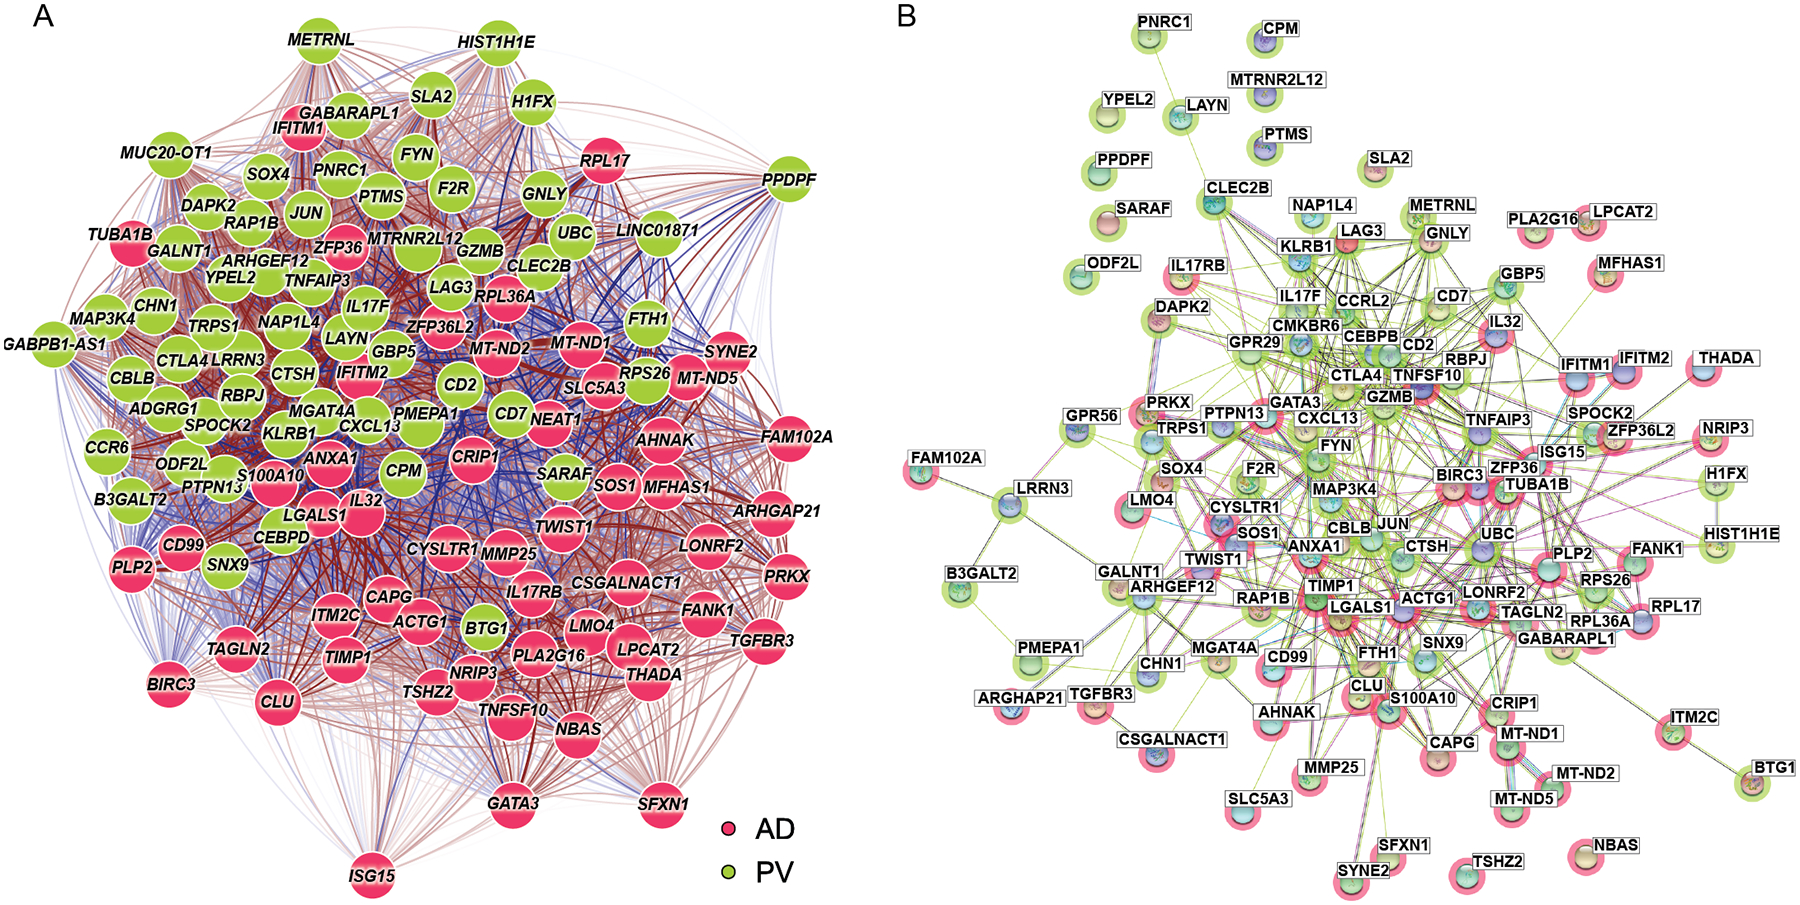
Fig. 5. Atopic dermatitis and Psoriasis vulgaris -specific DEGs segregate discretely based on unbiased pathway and network analysis.

A) Transcriptional network (qgraph) for Trm1 AD- and PV- specific genes (Table S7). The Fruchterman-Reingold algorithm was used to determine the network layout. Color shading of the gene nodes denotes AD (green) or psoriasis (red)–upregulated genes. Red lines represent positive correlation while blue lines represent negative correlation. Edges and links are shown for the correlation values from scRNA-seq data, with stronger edge intensity or thicker connecting links signifying higher correlation. B) STRING protein-protein network analysis for the same Trm1 AD- and PV- specific genes. Color shading of the nodes denotes AD (green) or psoriasis (red)–specific genes.
