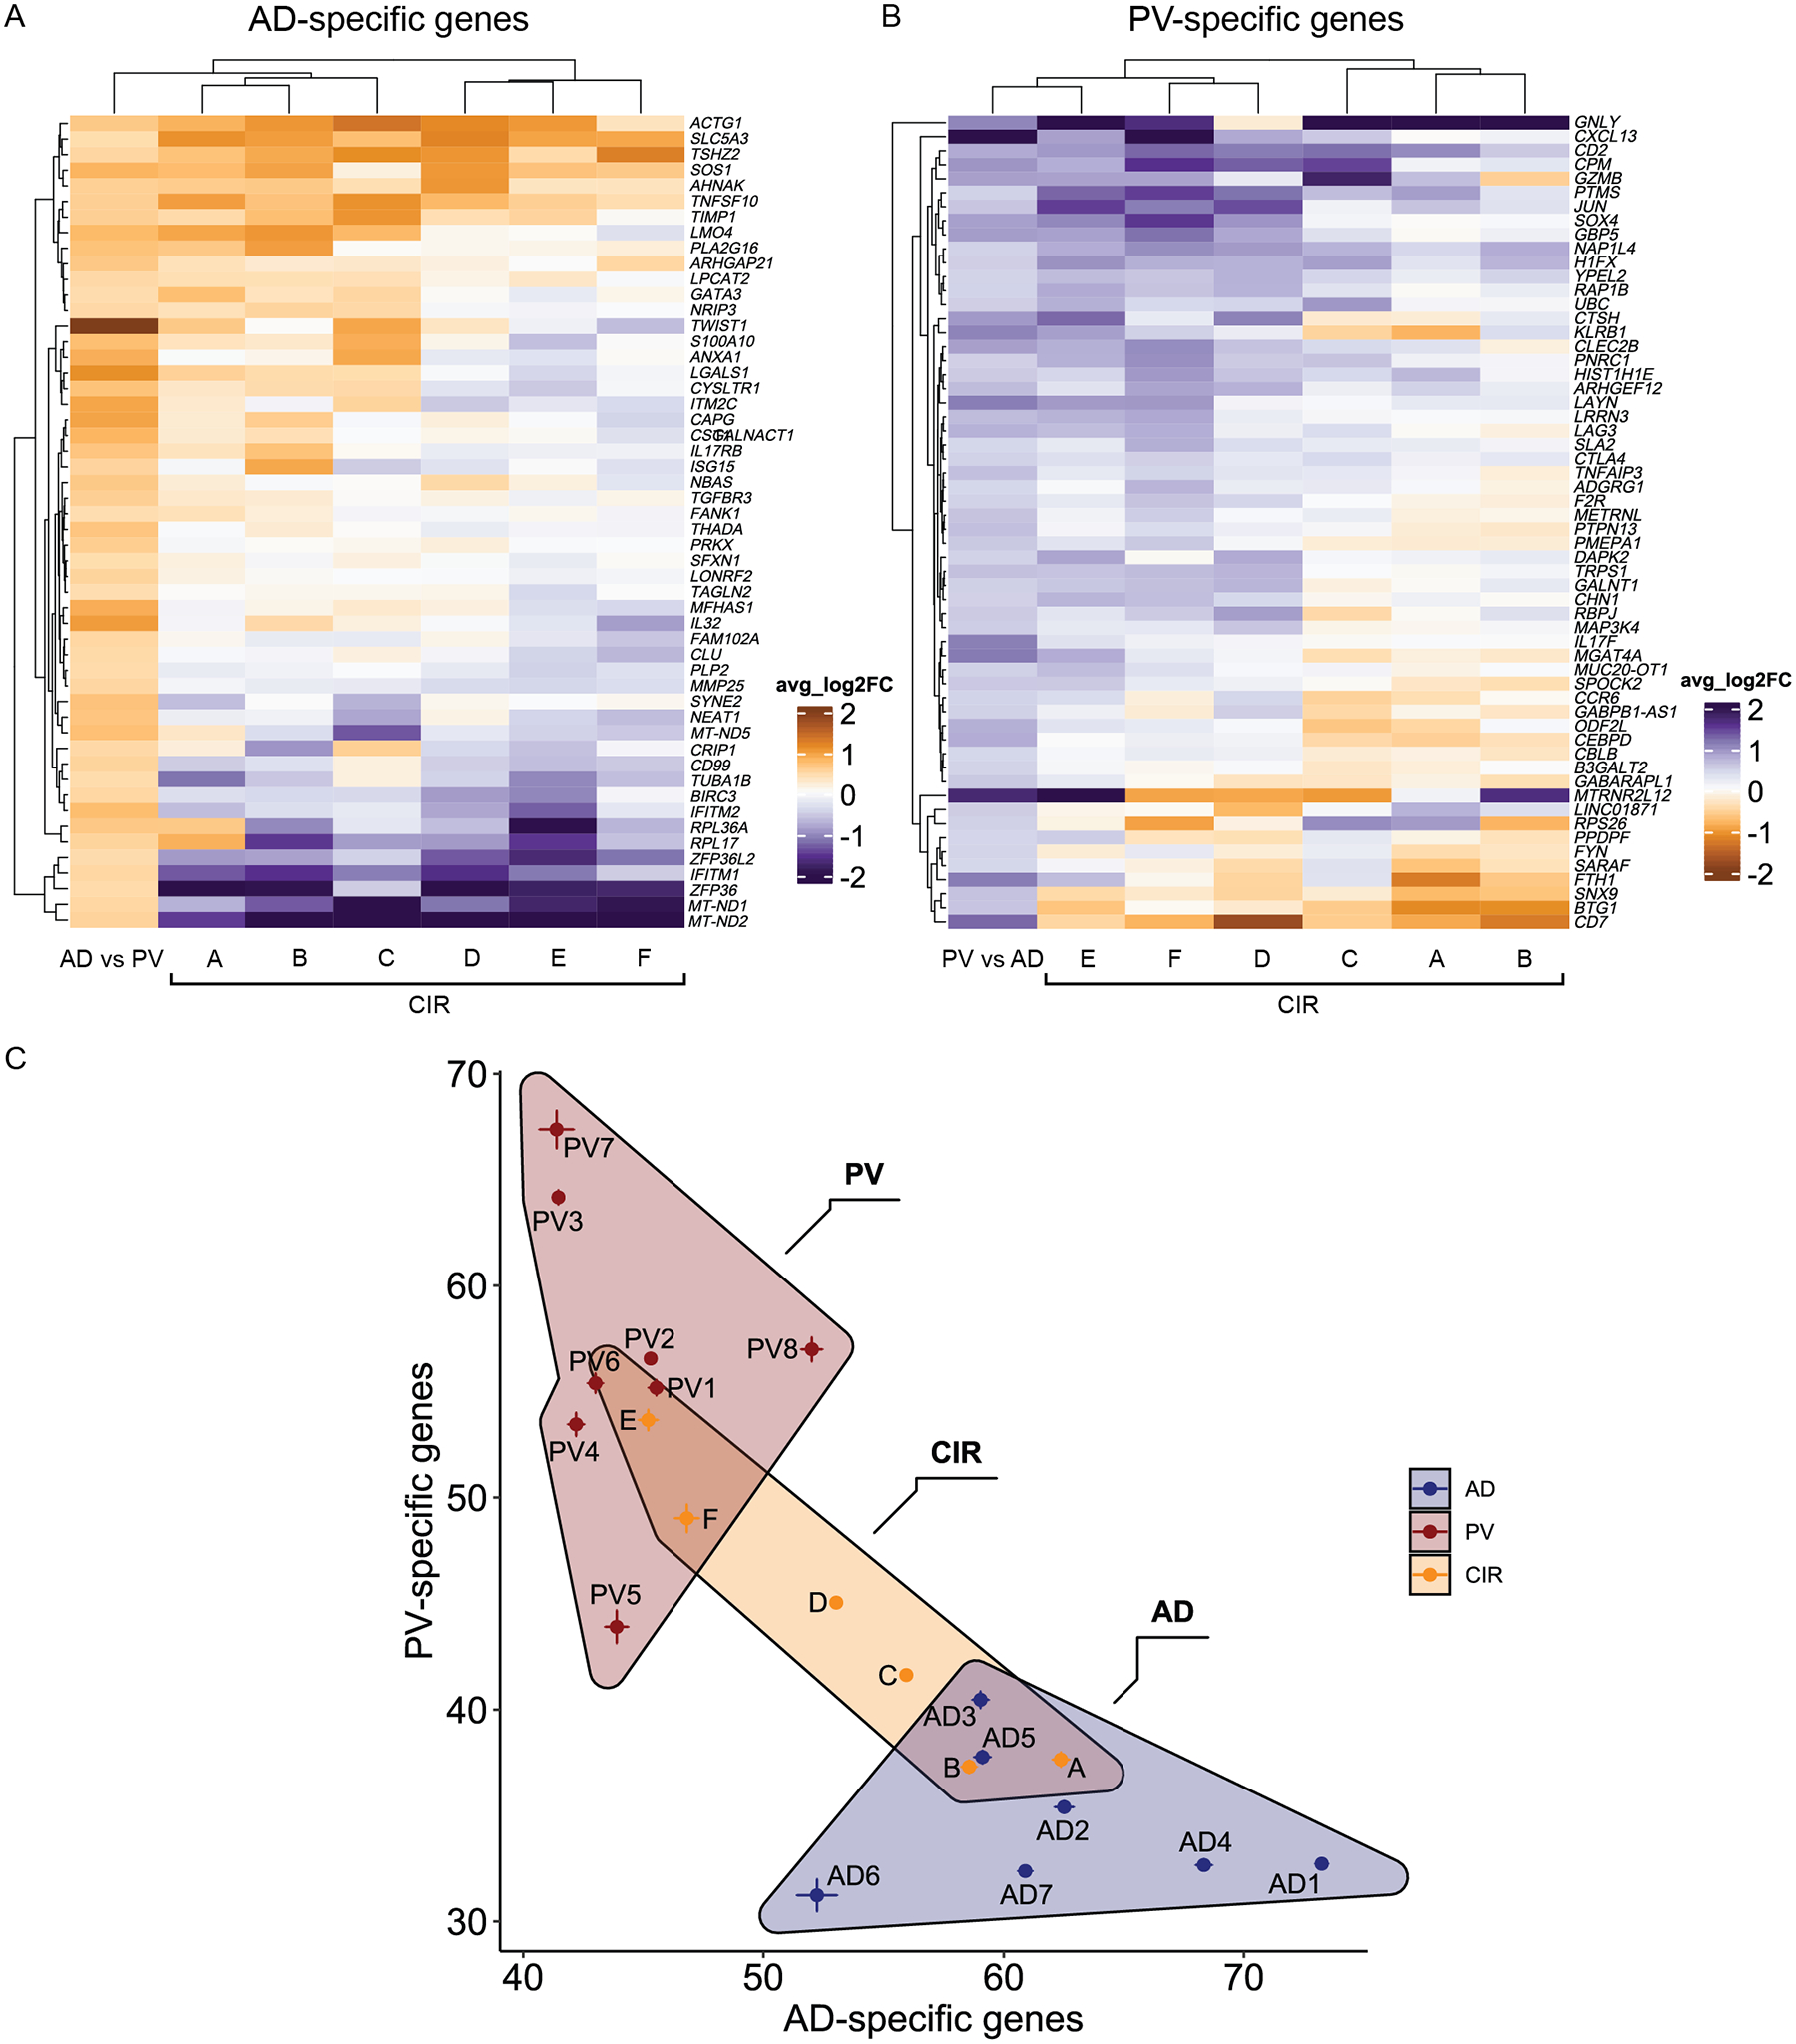
Fig. 6. Clinical/histopathologically Indeterminate Rashes (CIRs) show molecular stratification with atopic dermatitis or psoriasis-specific DEGs.

A) Heatmap showing relative expression levels (avg_log2FC) for each CIR Trm1 cell population relative to Trm 1 cells from all 7 healthy controls. Column 1 shows avg_log2FC values for Trm1 cells from 7 AD versus 8 PV samples. Genes depicted are Trm1 AD-specific genes (Table S7). B) Same as A except genes depicted are Trm1 PV-specific genes (Table S7). Column 1 shows avg_log2FC values for Trm1 cells from all PV versus all AD samples. C) Hyperdimensionality plot showing stratification of CIR samples relative to AD and PV samples. Each AD, PV, and CIR sample is mapped based on aggregate gene score of Trm1 population AD-specific genes (x-axis) and PV-specific genes (y-axis). One-sided Mann-Whitney tests used to calculate significance and p-values shown in Table S8.
